
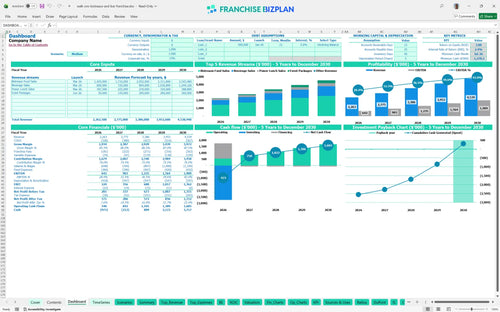
All-in-one Dashboard
Core inputs and core outputs


This franchise unit financial model template provides a detailed roadmap for managing a high-volume restaurant from pre-opening through five years of growth.
Core inputs and core outputs
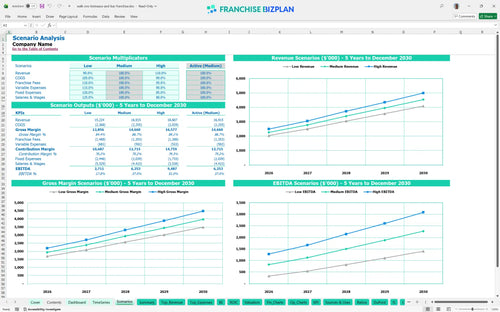
Three scenario analysis
Presentation ready
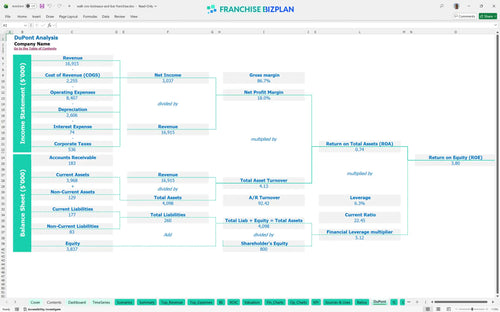
DuPont analysis
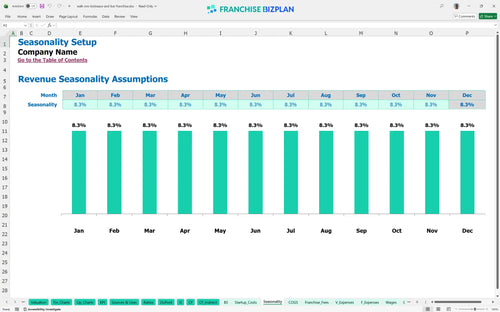
Researched revenue assumptions
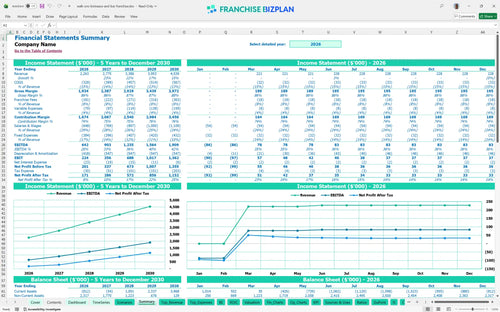
Lender-friendly financial outputs
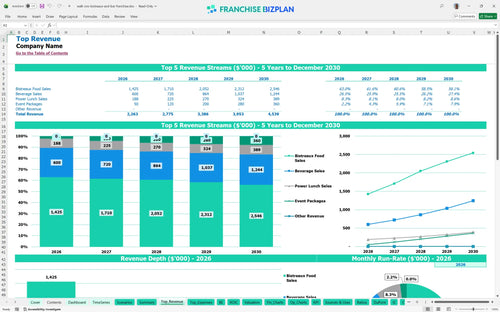
Revenue stream detailed view
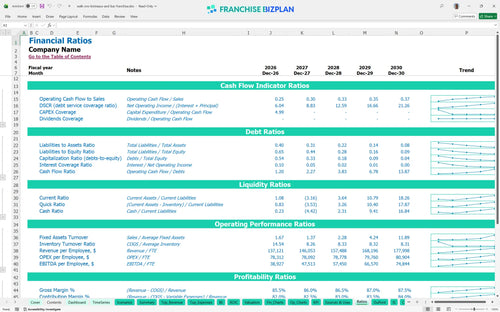
Performance metrics benchmark
We built this model using detailed research on high-volume sports bar operations to ensure your projections are grounded in reality. Key assumptions like the $60,000 franchise fee, 8% total brand fees, and $2.7 million in total startup costs are pre-loaded but fully editable to match your specific site. With Year 1 revenue starting at $2,263,000, this tool helps you manage the tight margins of a scratch-kitchen operation.
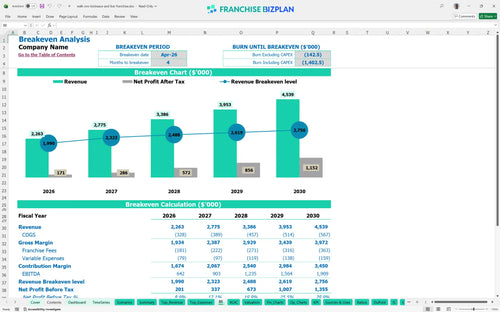
The unit is projected to reach its operating break-even point in April 2026, just four months after launching food sales. While Year 1 EBITDA starts at $642,000, the trajectory climbs significantly to $1.9 million by Year 5 as event packages and beverage sales scale up.
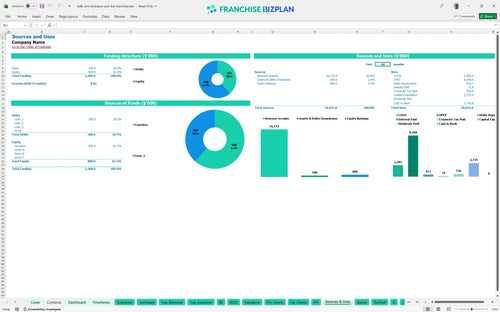
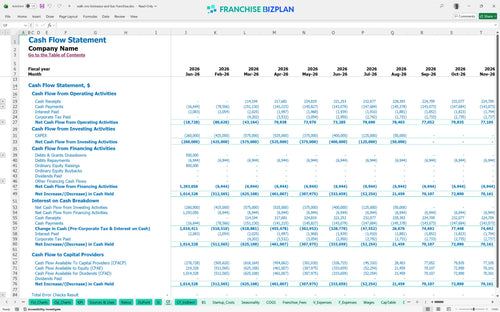
Launching this unit in the US requires a heavy initial investment of over $2.7 million, primarily driven by $1.2 million in leasehold improvements and $450,000 in kitchen equipment. You defintely need to plan for a lowest cash point of -$1,278,000 in July 2026 to cover the gap between build-out and full revenue ramp.
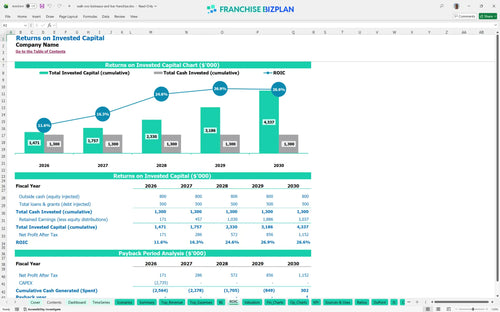
Investors can expect a 5-year payback period with an Internal Rate of Return (IRR) of 2.38% and a Return on Equity (ROE) of 3.8. While the initial cash outlay is substantial, the average net margin improves as annual revenue grows from $2.2 million to $4.5 million over the five-year forecast.
The monthly break-even point is achieved in month 4 of operations, provided you hit the target volume for 'Bistreaux' food sales. The primary driver affecting this timing is the $20,000 monthly rent combined with the 8% royalty and marketing burden, which requires high throughput to offset.
The lowest cash point hits in July 2026, meaning you need at least seven months of runway from the start of construction to survive the ramp-up. We recommend an additional cash buffer to handle potential delays in signage or IT system installation which could push back the full launch.
Switching to a High scenario by maximizing 'Power Lunch' and event revenue can pull the payback period forward and significantly increase the 3.8 ROE. The model shows that even a small increase in beverage sales has a massive impact on Year 1 margins because fixed costs like the $75,000 GM salary stay constant.
Finance: update unit break-even and payback model by Friday
This restaurant franchise financial model is built in Excel with fully editable formulas and assumptions, allowing you to stress-test your specific territory. You can adjust everything from seating capacity to local tax rates, making it easy to see how different operating scenarios impact your bottom line before you sign a lease.

Planning for a high-volume sports bar requires a long-term view, so this franchise financial projection template covers a full 60-month period. It tracks the transition from the heavy construction phase to stabilized operations, giving you a clear look at how Year 5 revenue can climb toward $4.5 million as your local reputation matures.

Our franchise unit business plan template handles the specific math of brand ownership, including the 5% royalty and 3% marketing fund contributions. By automating these calculations against gross sales, you can see exactly how much cash stays in the unit after the franchisor takes their 8% cut.

Calculating the sports bar franchise startup costs is the most critical step for any new operator, especially with leasehold improvements hitting $1.2 million. This model aggregates your kitchen equipment, AV suites, and furniture costs to determine the exact monthly revenue needed to cover your $31,000+ fixed monthly overhead.

This restaurant investment analysis spreadsheet includes researched benchmarks for food and beverage unit economics to help you sanity-check your projections. If your kitchen labor or packaging costs drift too far from the 12% food cost targets, the model helps you identify the leak before it impacts your debt service coverage.


Simply purchase and download the financial model template, then access it instantly using Microsoft Excel or Google Sheets. No installation or technical expertise required-just open and start working.

Enter your business-specific numbers, including revenue projections, costs, and investment details. The pre-built formulas will automatically calculate financial insights, saving you time and effort.

Leverage the investor-ready format to confidently showcase your financial projections to banks, franchise representatives, or investors. Impress stakeholders with clear, data-driven insights and professional reports.

Leverage the investor-ready format to confidently present your projections to banks, franchise representatives, or investors.