
All-in-one Dashboard
Core inputs and core outputs


This fast casual restaurant financial model provides a complete roadmap for managing a single-unit operation from initial build-out through five years of mature cash flow. One tool, total clarity.
Core inputs and core outputs
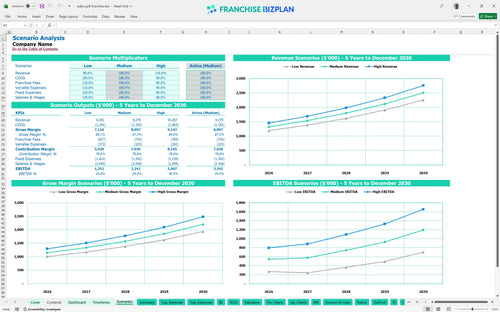
Three scenario analysis
Presentation ready
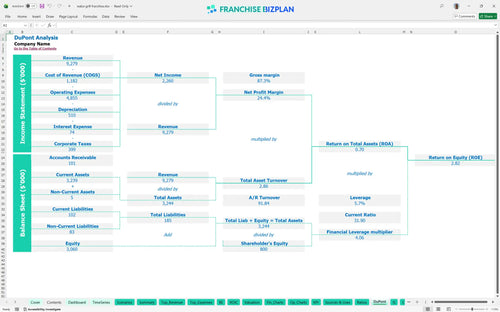
DuPont analysis
Researched revenue assumptions
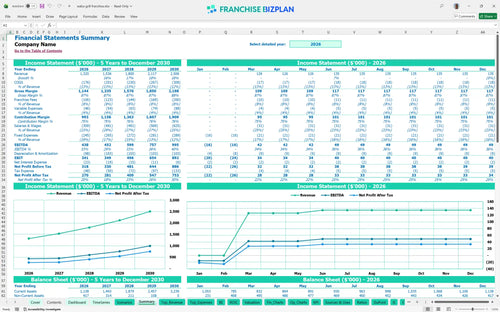
Lender-friendly financial outputs
Revenue stream detailed view
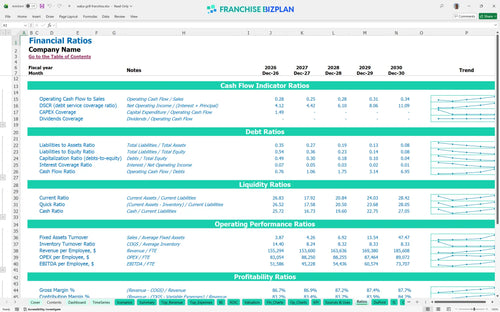
Performance metrics benchmark
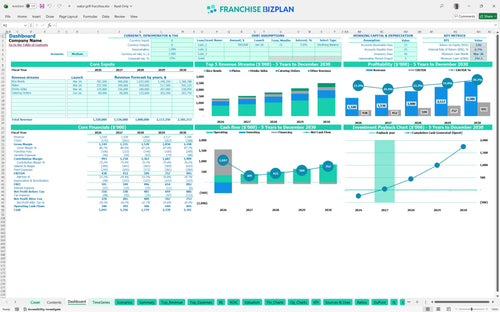
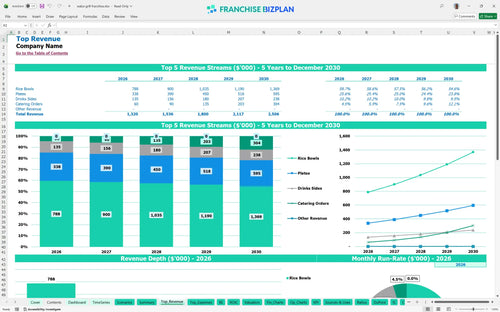
We built this restaurant franchise unit profit and loss template using detailed research to ensure your projections are grounded in operational reality. The model comes pre-populated with key metrics, including a year-one revenue target of $1,320,000 and a projected EBITDA of $438,000, all of which are fully editable to match your specific location. This data-driven approach helps you move from guessing to executing with confidence.
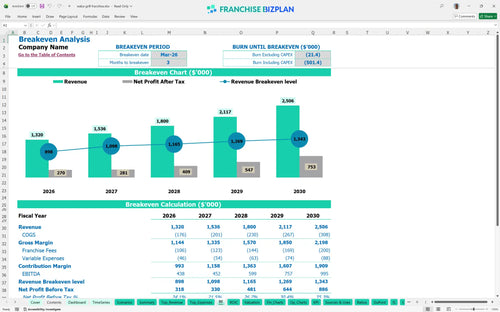
This unit is projected to reach profitability by March 2026, just three months after the initial launch. By year five, the restaurant franchise unit profit and loss template shows EBITDA scaling to $995,000 as catering and repeat demand drive higher throughput. Profit is what you keep after the brand takes its share.
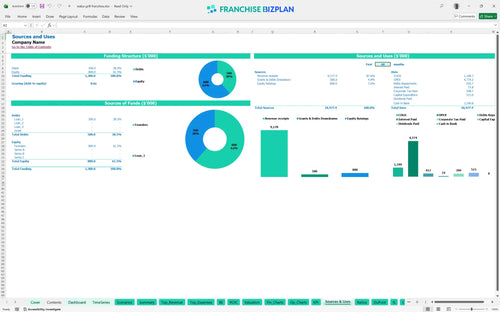
To launch this unit, you need to know how to calculate startup costs for a restaurant franchise, which total approximately $515,000. This capital expenditure covers the $35,000 franchise fee, $250,000 in leasehold improvements, and $120,000 for essential kitchen equipment like grills and refrigeration. Know your entry cost before you sign.
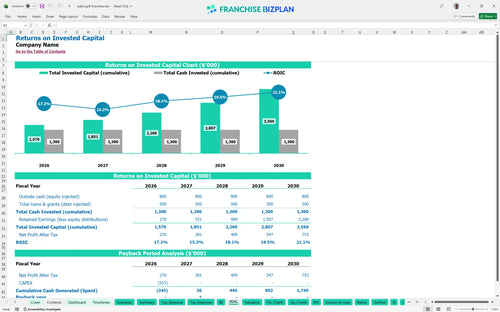
When evaluating franchise investment potential, this model estimates an Internal Rate of Return (IRR) of 6.67% and a Return on Equity (ROE) of 2.82. Calculating ROI for fast casual restaurant franchise units shows a payback period of 2 years, which is highly competitive for the sector. Time is money, and two years is a fast return.
The unit hits its monthly break-even point in March 2026, driven primarily by the $13,500 monthly rent for a prime location. Reaching this milestone depends on maintaining high volume in rice bowls and plates while managing the 8% combined royalty and marketing burden. Volume solves almost every problem.
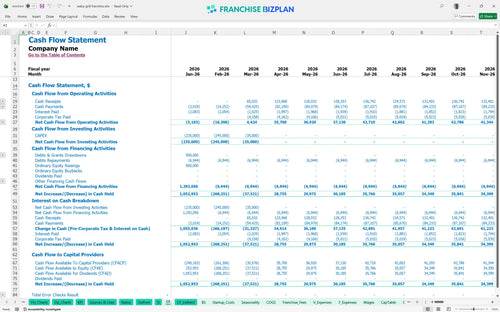
The franchise unit operating budget spreadsheet identifies the lowest cash point as $747,000 in March 2026. This restaurant franchise cash flow forecasting tool suggests maintaining a buffer to cover the ramp-up period before catering revenue begins to scale in June. Cash is oxygen for a new store.
Projecting revenue for new restaurant franchise units requires looking at multiple outcomes; a high-growth scenario pushes year-five revenue to $2,506,000. The model shows that even small improvements in average ticket or labor productivity can significantly accelerate your payback timeline and peak cash position. Plan for the worst, execute for the best.
Finance: update unit break-even and payback model by Friday.
This Excel financial model for quick service restaurant operations allows you to adjust every variable from rice bowl pricing to local hourly wages. Since every territory faces different rent and labor pressures, these editable assumptions ensure your franchise financial model reflects your specific market rather than a generic estimate. Control your numbers or they will control you.

Long-term planning is essential for any franchise unit profitability analysis, especially when scaling from one store to a multi-unit territory. This model provides pro forma financial statements that project growth from $1.32M in year one to over $2.5M by year five, helping you visualize the long-term cash flow and store-level margins. Growth is a marathon, not a sprint.

The model accurately captures your ongoing royalty fee structure and marketing fund contributions to show the true cost of brand alignment. By tracking the 5% royalty and 3% marketing fee against gross sales, you can see exactly how these operating expenses impact your bottom line before you cover local overhead. Royalties are the price of brand power.

Understanding your restaurant franchise startup costs is the first step toward financial due diligence for prospective franchisees. This tool includes a detailed break-even analysis, showing that with a $515,000 initial investment, you can reach sustainability within three months if volume targets are met. Speed to break-even is the only metric that matters at launch.

This pre-written Excel model for restaurant franchise operations includes built-in benchmarks to help you defintely sanity-check your food costs and labor spend. Comparing your 11% ingredient cost and $13,500 monthly rent against industry standards ensures your projections remain grounded in reality. Benchmarks keep your ego in check.


Simply purchase and download the financial model template, then access it instantly using Microsoft Excel or Google Sheets. No installation or technical expertise required-just open and start working.

Enter your business-specific numbers, including revenue projections, costs, and investment details. The pre-built formulas will automatically calculate financial insights, saving you time and effort.

Leverage the investor-ready format to confidently showcase your financial projections to banks, franchise representatives, or investors. Impress stakeholders with clear, data-driven insights and professional reports.

Leverage the investor-ready format to confidently present your projections to banks, franchise representatives, or investors.