
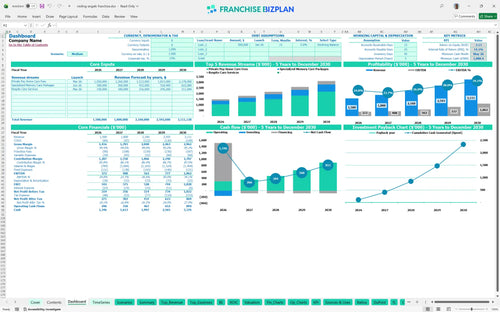
All-in-one Dashboard
Core inputs and core outputs


This franchise unit financial model template provides a comprehensive toolkit for forecasting revenue, managing complex payroll, and analyzing multi-year ROI for a senior care agency.
Core inputs and core outputs
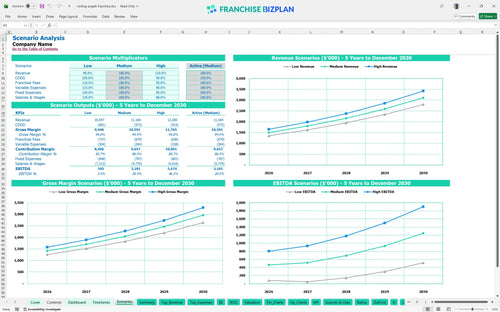
Three scenario analysis
Presentation ready
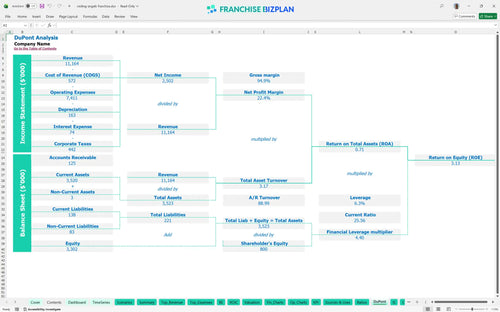
DuPont analysis
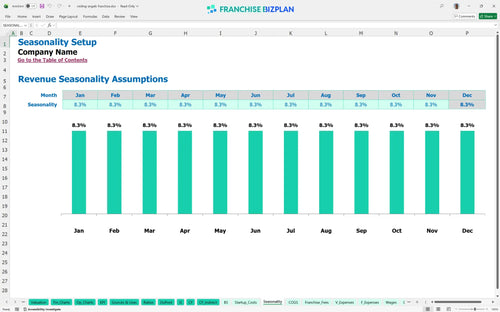
Researched revenue assumptions
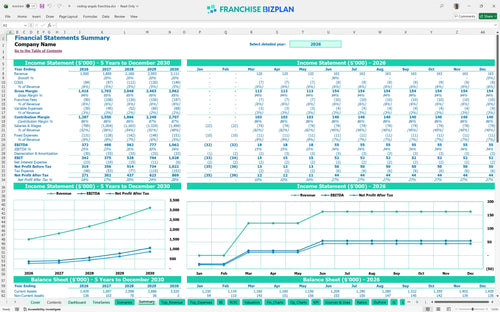
Lender-friendly financial outputs
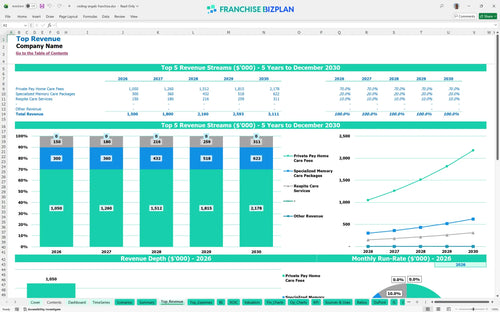
Revenue stream detailed view
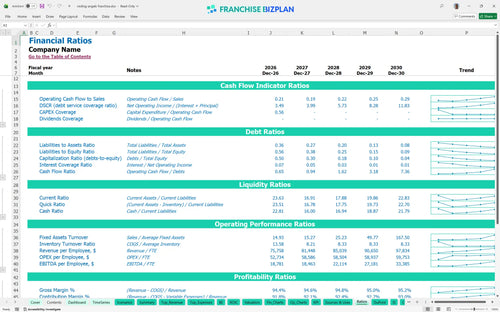
Performance metrics benchmark
We built this home care franchise financial model using detailed market research to ensure every assumption reflects the reality of a premium agency. Key drivers like private pay fees starting at $700,000 and specialized memory care packages are pre-populated but fully editable to fit your local market. With a Year 1 revenue target of $1,500,000 and an initial EBITDA of $372,000, this tool gives you a data-driven roadmap for scaling a concierge-level service.
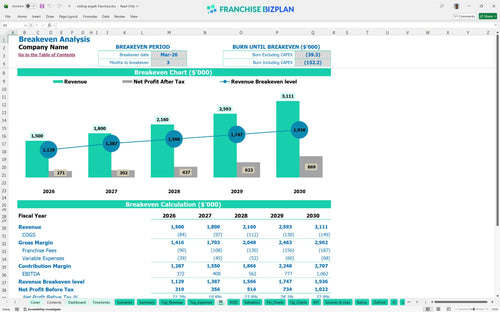
The unit hits profitability almost immediately due to the high-margin nature of private pay services, with a breakeven date of March 2026. By Year 1, you are looking at an EBITDA of $372,000 after accounting for all royalties and the $105,000 executive director salary. This rapid ramp-up assumes you hit your $1.5M revenue target through strong referral networks and local density. Speed to profit is the primary goal here.
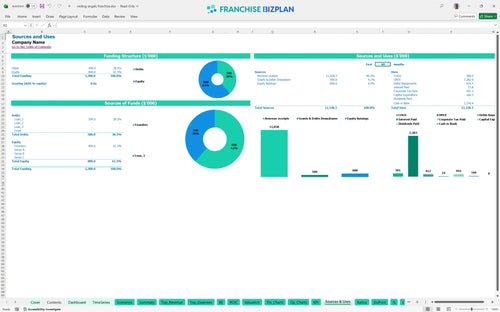
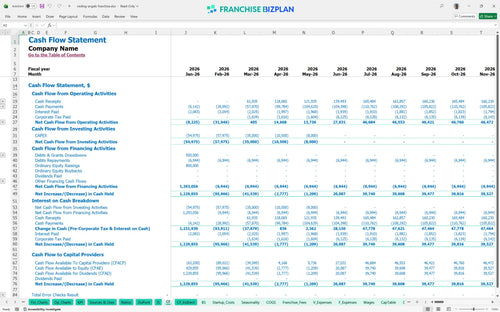
You will need approximately $166,450 in hard startup costs, which includes the $51,950 franchise fee and $50,000 for leasehold improvements. The model also accounts for a significant cash buffer, as the minimum cash point hits $1,088,000 in May 2026 to cover ramp-up and working capital. This ensures you have the runway to hire your recruiter and scheduling coordinators before the first client billings arrive. Capital allocation is about timing as much as it is about the total amount.
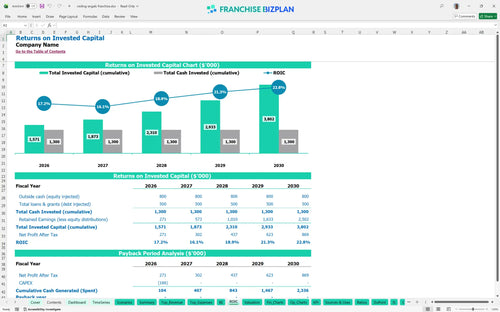
The internal rate of return (IRR) for this unit is 14.1%, which is solid for a service-based healthcare franchise profitability analysis. While the payback period extends after year 5, the return on equity (ROE) of 3.13 indicates strong long-term value creation. Most of your value is captured in the back half of the five-year plan as revenue grows to $3.1M. Patience in the first two years pays off in the final three.
You reach the break-even point in just 3 months, provided you can generate enough volume to cover roughly $11,150 in monthly fixed costs plus variable labor. The biggest lever here is the caregiver-to-client ratio and your ability to maintain a high average ticket through specialized care. If your $6,500 rent or $105,000 executive salary isn't supported by steady monthly sales, the timeline shifts. Watch your fixed cost coverage like a hawk.
Your lowest cash point occurs in May 2026, with a projected balance of $1,088,000. This suggests the model assumes a high initial capitalization to handle the scaling of a large caregiver pool, which grows from 15 to 26 FTE (full-time equivalent) staff. You need to watch your billing cycles closely to ensure that mileage reimbursements and supplies don't outpace your private pay collections. Cash is the oxygen that fuels your growth.
In a high-growth scenario where revenue hits the $3.1M mark by Year 5, your EBITDA margin expands significantly as fixed costs like the $6,500 rent are diluted. Conversely, a low scenario where memory care adoption is slow could delay your payback period and increase the total capital at risk. The model shows that even a small shift in caregiver supply costs can impact your Year 1 $372k EBITDA target. Scenarios help you prepare for the worst while aiming for the best.
Finance: update unit break-even and payback model by Friday.
This home care franchise financial model is a fully customizable Excel tool designed for high-stakes decision making. You can adjust pre-filled formulas and editable assumptions to match your specific territory, whether you are looking at a single unit or a multi-unit expansion. It defintely simplifies the complex math of senior care by letting you toggle revenue drivers and local labor rates in real-time. Every cell is open, so you can stress-test your own numbers without breaking the logic.

Planning for the long haul is critical when managing a senior care franchise business plan with multiple revenue streams. This model provides detailed 5-year projections for revenue, costs, and cash flow, ensuring you see the full picture of your investment. You can track how specialized memory care and respite services scale over sixty months to understand your long-term wealth creation potential. It maps the transition from a startup phase to a mature, high-volume agency. Long-term clarity is the only way to manage multi-unit growth effectively.

Managing the 3.5% royalty and 2.5% marketing fund is non-negotiable for any operator in this system. This tool captures these franchise-specific financial obligations alongside the initial $51,950 franchise fee to show you the true net margin. By automating these calculations, you can focus on store-level performance without worrying about missing a brand-mandated expense. Honestly, the royalty burden is often the difference between a healthy unit and a struggling one. It keeps your overhead projections precise from day one.

Knowing how to calculate startup costs for a home care franchise is the difference between a smooth launch and a sudden cash crunch. The model breaks down the $166,450 initial capital requirement and provides a clear break-even analysis based on your fixed monthly overhead. It maps out exactly how much private pay volume you need to cover the $6,500 monthly office rent and executive salaries. You need to know your floor before you can reach for the ceiling. This section ensures you don't run out of fuel before the revenue kicks in.

This healthcare franchise profitability analysis includes built-in benchmarks to ensure your projections stay grounded in reality. You can compare your labor costs against industry standards to identify potential margin leaks before they happen. It helps you sanity-check your gross margin assumptions against typical ranges for premium, non-medical care. Plus, it uses real-world data to validate your average ticket and caregiver productivity. Don't fly blind when you can use proven industry data to guide your flight path.


Simply purchase and download the financial model template, then access it instantly using Microsoft Excel or Google Sheets. No installation or technical expertise required-just open and start working.

Enter your business-specific numbers, including revenue projections, costs, and investment details. The pre-built formulas will automatically calculate financial insights, saving you time and effort.

Leverage the investor-ready format to confidently showcase your financial projections to banks, franchise representatives, or investors. Impress stakeholders with clear, data-driven insights and professional reports.

Leverage the investor-ready format to confidently present your projections to banks, franchise representatives, or investors.