
All-in-one Dashboard
Core inputs and core outputs


This model provides a complete toolkit for forecasting revenue, managing high-volume labor costs, and calculating the ROI for a full-service breakfast and dessert franchise unit.
Core inputs and core outputs
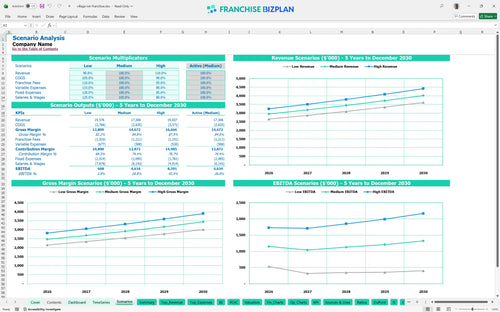
Three scenario analysis
Presentation ready
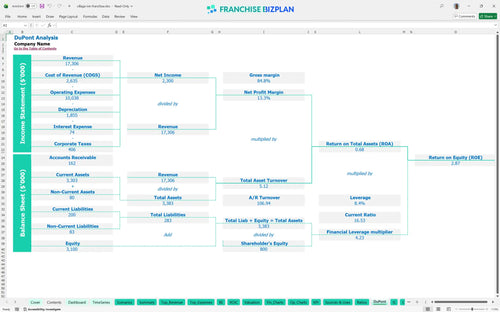
DuPont analysis
Researched revenue assumptions
Lender-friendly financial outputs
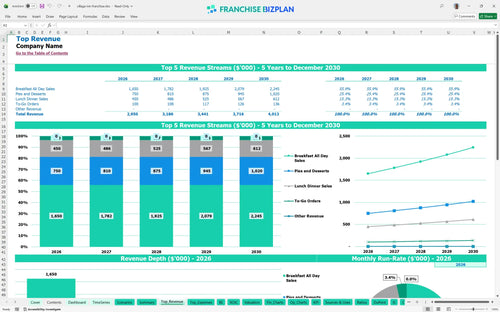
Revenue stream detailed view
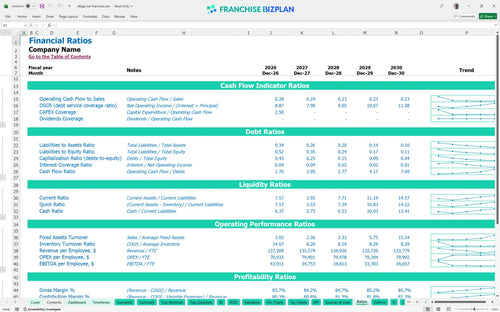
Performance metrics benchmark
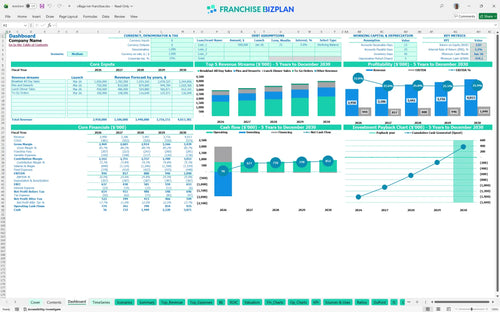
We built this franchise unit financial model using deep research into the family-style dining sector. Key assumptions like the $1.1M breakfast revenue stream and $2M in total CAPEX are pre-populated and fully editable to match your specific site. This tool helps you navigate the $434,000 minimum cash requirement and the 5-year payback period without flying blind.
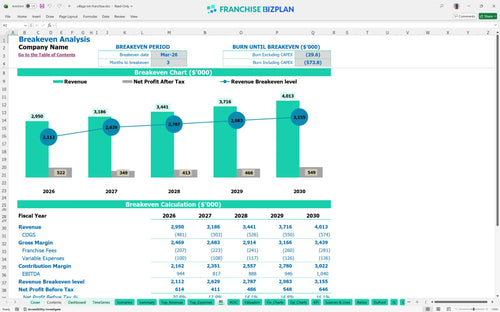
This unit hits its breakeven point in March 2026, just three months after launching. While Year 1 EBITDA is a strong $944,000, remember that high initial labor costs for 8 servers and 3.5 line cooks will pressure early margins. Profitability is defintely achievable early if you manage the pie-to-go counter effectively and keep food costs under 14.5%.
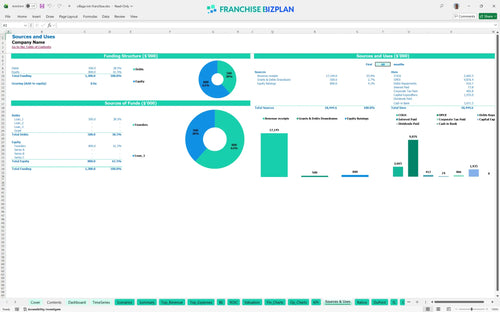
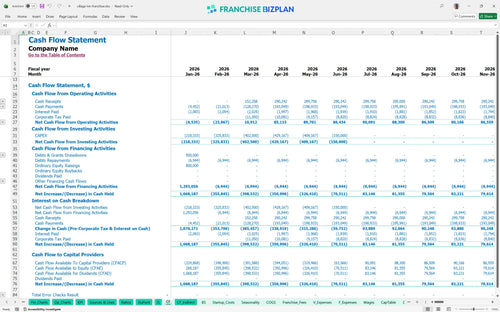
You will need roughly $2M to get the doors open, with the largest chunk going to $900,000 in leasehold improvements and $450,000 for kitchen equipment. The model also accounts for a $35,000 franchise fee and $100,000 for HVAC and plumbing. Honestly, the $434,000 cash dip in June 2026 means you need a solid working capital reserve to survive the ramp-up.
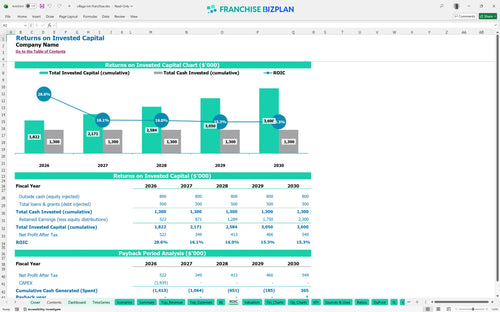
Investors can expect an Internal Rate of Return (IRR) of 3.19% and a Return on Equity (ROE) of 2.87. The payback period is 5 years, which is standard for a high-CAPEX full-service restaurant. What this estimate hides is the potential for higher returns if you can scale to multiple units and share management overhead across the Superstition Springs district.
The unit reaches monthly breakeven by March 2026. The main driver is the high fixed cost of $20,000 for rent and nearly $33,000 in total monthly fixed expenses including marketing and utilities. To hit this fast, you need to maintain high throughput during the 'Power Breakfast' hours and keep the pie cases full to drive average ticket prices.
The lowest cash point occurs in June 2026 at negative $434,000, suggesting you need a substantial buffer beyond the initial build-out. You will need about 4-6 months of runway to handle the ramp-up of the 22.5 initial FTEs. Plus, do not forget the $30,000 pre-opening training cost that hits before the first dollar of revenue ever comes in.
In a High scenario, pushing Year 1 revenue past $2.95M significantly improves the 3.19% IRR. Conversely, a Low scenario where food costs stay at 14.5% instead of dropping to 12.5% will delay your 5-year payback. The model shows that even a 5% dip in breakfast sales can deeply impact your peak cash need during the first year of operations.
Finance: update unit break-even and payback model by Friday.
This franchise unit financial model is fully customizable in Excel, allowing you to swap out pre-filled formulas for your specific territory. You can adjust the $20,000 monthly rent or tweak the 14.5% food cost to see how it hits your bottom line. It is built for real-world testing, so you can model different staffing levels as your breakfast and pie sales grow over time.

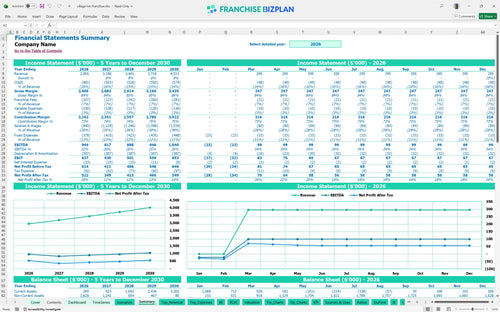
Looking at Year 1 revenue of $2,950,000 is just the start; this model tracks your growth to over $4,000,000 by Year 5. It maps out the transition from early-stage ramp-up to mature-unit performance, including how food cost efficiencies improve margins as you scale. Still, you need to watch the cash flow during the first 24 months to ensure you stay liquid.

The model handles the 4% royalty and 3% marketing fee automatically, so you know exactly what is leaving the business every month. At $2.95M in sales, that is $206,500 annually in brand-related fees before you even pay for eggs or flour. Understanding these top-line costs is vital for protecting your store-level EBITDA and overall restaurant profitability analysis.

With a $35,000 initial fee and $900,000 in leasehold improvements, the entry price is significant. This franchise business plan excel tool helps you find the exact sales volume needed to cover these heavy upfront investments. Here is the quick math: you need to hit the ground running to reach the March 2026 breakeven target and secure your ROI.

We have baked in industry standards for full-service dining, like the 14.5% food ingredient cost and 2.2% payment processing fees. Comparing your actuals against these benchmarks helps you spot margin leaks in areas like packaging or utilities early. It is about making sure your family-style restaurant stays competitive while you manage your capital expenditure budget.


Simply purchase and download the financial model template, then access it instantly using Microsoft Excel or Google Sheets. No installation or technical expertise required-just open and start working.

Enter your business-specific numbers, including revenue projections, costs, and investment details. The pre-built formulas will automatically calculate financial insights, saving you time and effort.

Leverage the investor-ready format to confidently showcase your financial projections to banks, franchise representatives, or investors. Impress stakeholders with clear, data-driven insights and professional reports.

Leverage the investor-ready format to confidently present your projections to banks, franchise representatives, or investors.