
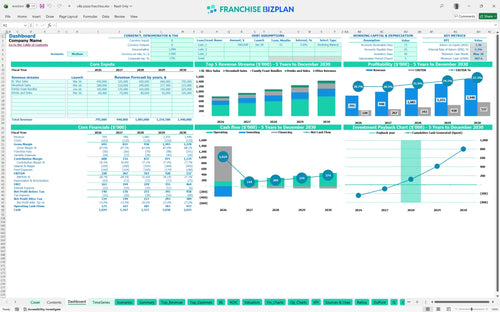
All-in-one Dashboard
Core inputs and core outputs


This franchise unit financial model template provides a complete Excel-based toolkit for projecting revenue, expenses, and cash flow for a high-volume pizza location.
Core inputs and core outputs
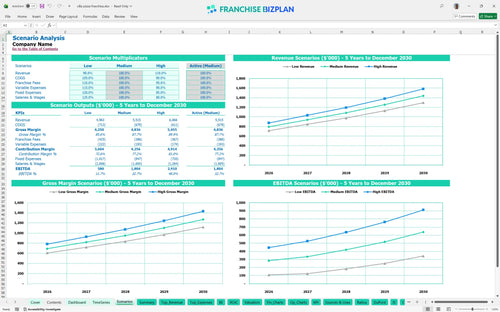
Three scenario analysis
Presentation ready
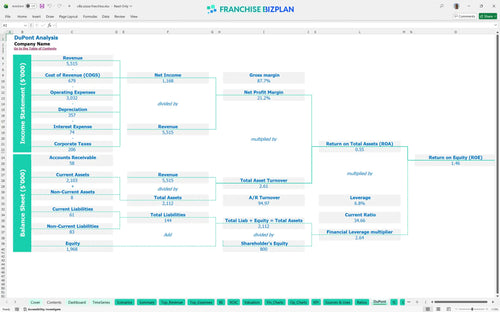
DuPont analysis
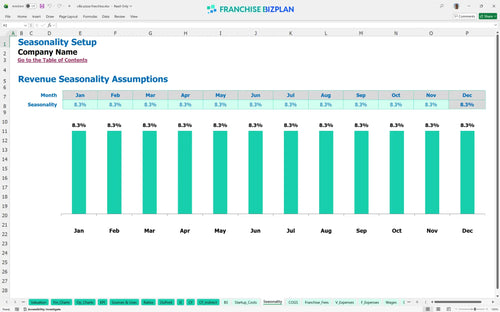
Researched revenue assumptions
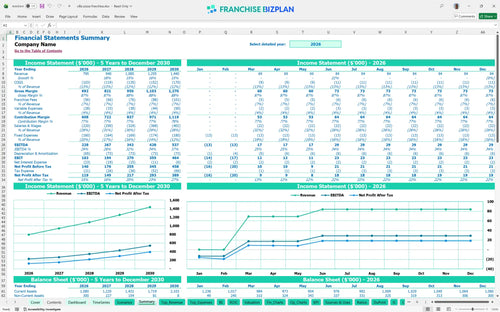
Lender-friendly financial outputs
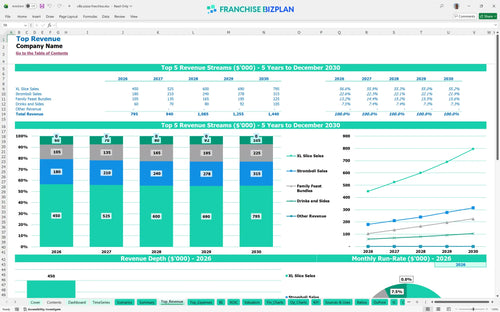
Revenue stream detailed view
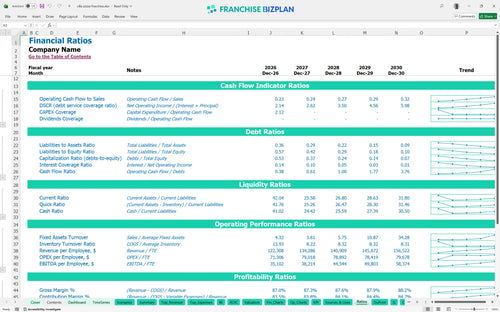
Performance metrics benchmark
We built this pizza franchise financial model using deep-dive research into food court operations and Italian quick-service standards. Key assumptions like the $25,000 franchise fee, $120,000 in leasehold improvements, and specific labor tiers are pre-populated but fully editable. With a year-one EBITDA of $228,000, this tool helps you validate if the unit meets your personal wealth goals before you sign the FDD (Franchise Disclosure Document).
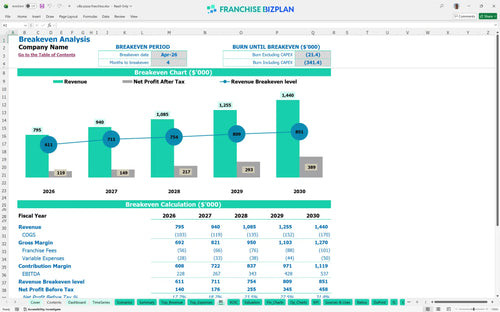
This unit hits its stride quickly, reaching breakeven by April 2026, just four months after launching. By year two, EBITDA (earnings before interest, taxes, depreciation, and amortization) climbs to $267,000 as food costs drop from 11.5% to 11.2% through better waste management and volume buying.
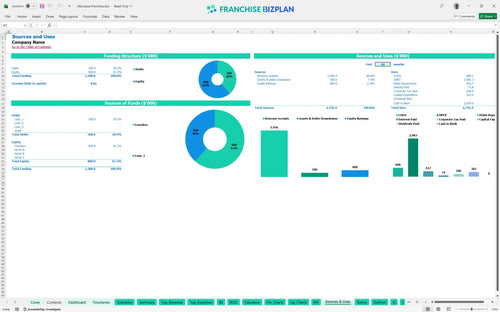
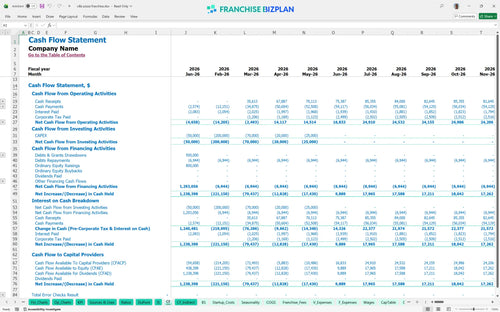
You'll need a startup budget spreadsheet for pizza restaurant planning that accounts for the $365,000 in CAPEX (capital expenditures) plus working capital. The model shows a minimum cash requirement of $908,000 by May 2026 to ensure you survive the ramp-up phase without running dry before the profits start rolling in.
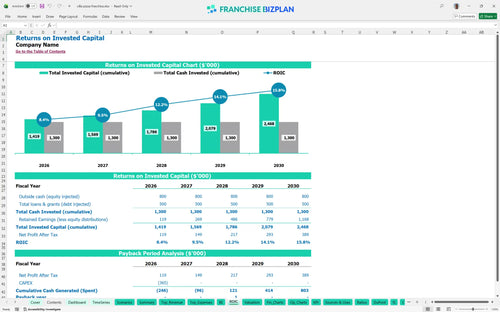
Calculating return on investment for restaurant franchise units is simple with this tool. You are looking at a 3-year payback period and an IRR (internal rate of return) of 5.32%. While the ROE (return on equity) sits at 1.46, the steady climb in annual revenue to $1.44 million by year five suggests strong long-term equity growth.
Your financial projections for high volume restaurant location show a 4-month path to break-even. The primary driver is throughput; with $7,500 in monthly rent and 7% in combined franchise fees, you need consistent daily traffic to cover these fixed obligations and start generating positive cash flow.
The lowest cash point occurs in May 2026 at $908,000. This estimate hides the fact that a delay in mall construction could burn through your buffer fast, so you defintely want to maintain a 3-month operating reserve to handle any seasonal dips in mall foot traffic or unexpected repairs.
Analyzing restaurant franchise unit profitability requires looking at the what-ifs. A high-revenue scenario moves your year-5 EBITDA toward $537,000, while a low-revenue year might stretch your payback beyond 4 years. The model shows how a 10% swing in labor or COGS (cost of goods sold) can shift your cash floor significantly.
Finance: update unit break-even and payback model by Friday.
This pizza franchise financial model lives in Excel, so you can tweak every variable to fit your specific market. It comes with pre-filled formulas for a food court business model, but you can swap out rent, labor rates, or slice prices to see how they impact your bottom line. It's defintely built for operators who need to test different what-if scenarios before signing a lease or committing capital.

Multi-unit success starts with a long-range view of your cash and commitments. This model tracks your franchise unit business plan template over 60 months, showing how revenue scales from $795,000 in year one to over $1.4 million by year five. You get a full look at the P&L, balance sheet, and cash flow to ensure your quick service restaurant financial model stays healthy as volume grows.

Franchising isn't free, and you need to know how to model franchise royalty and marketing fees accurately to protect your margins. We've baked in the 6% royalty and 1% marketing fund contributions so you can see the exact impact on your restaurant unit economics. This ensures you account for every dollar going back to the franchisor before you calculate your actual take-home pay or reinvestment fund.

Use our restaurant franchise startup costs spreadsheet to total your initial $365,000 investment including equipment and fees. We help you calculate the exact sales volume needed to cover your $7,500 monthly rent and $2,500 CAM (common area maintenance) fees. Knowing your break-even point helps you manage the early months when every customer through the door counts toward your survival and eventual payback.

Don't guess on your franchise profitability analysis template; use data to validate your assumptions. We include benchmarks for food costs, starting at 11.5%, and labor to ensure your projections are realistic for the pizza industry. If your numbers look too good to be true compared to typical restaurant unit economics, the model flags it so you can adjust your expectations for a high-volume location.


Simply purchase and download the financial model template, then access it instantly using Microsoft Excel or Google Sheets. No installation or technical expertise required-just open and start working.

Enter your business-specific numbers, including revenue projections, costs, and investment details. The pre-built formulas will automatically calculate financial insights, saving you time and effort.

Leverage the investor-ready format to confidently showcase your financial projections to banks, franchise representatives, or investors. Impress stakeholders with clear, data-driven insights and professional reports.

Leverage the investor-ready format to confidently present your projections to banks, franchise representatives, or investors.