
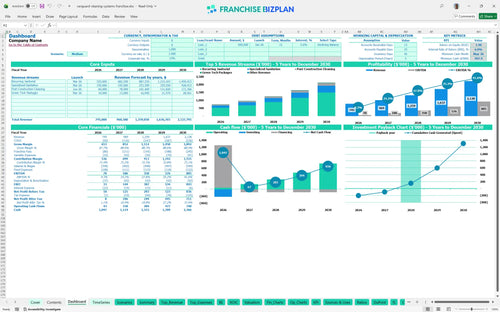
All-in-one Dashboard
Core inputs and core outputs


This comprehensive commercial cleaning franchise financial model provides a step-by-step guide to cleaning franchise financial projections, covering everything from initial equipment purchases to five-year cash flow management.
Core inputs and core outputs
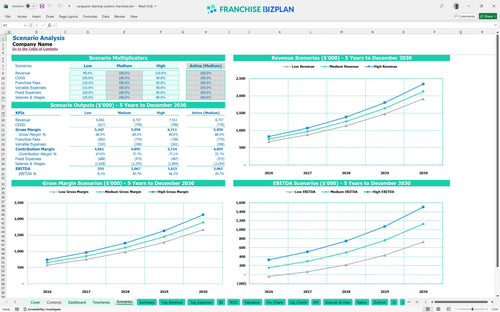
Three scenario analysis
Presentation ready
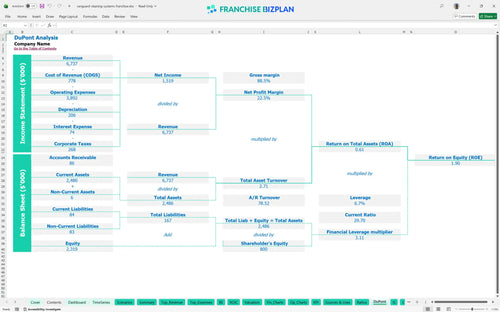
DuPont analysis
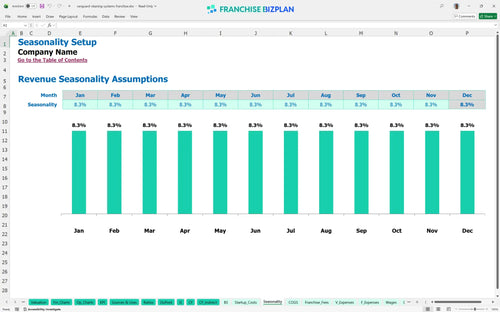
Researched revenue assumptions
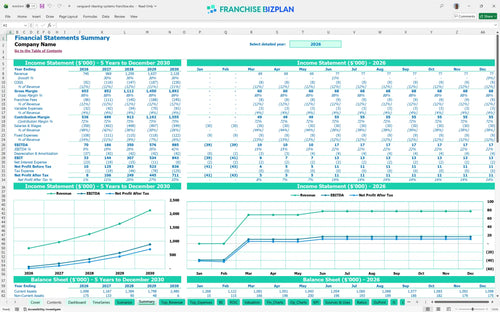
Lender-friendly financial outputs
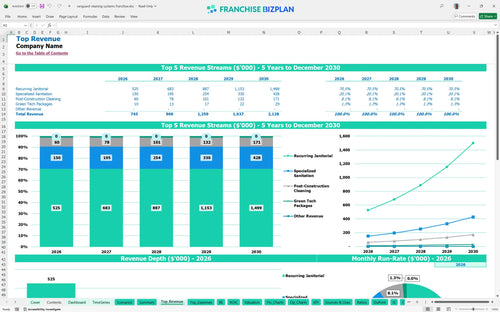
Revenue stream detailed view
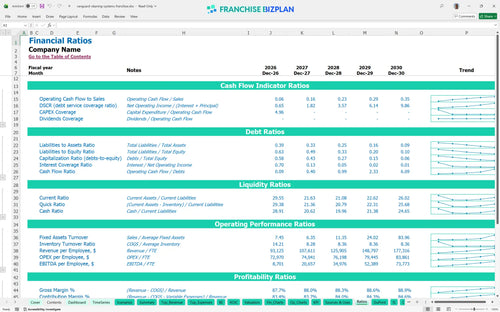
Performance metrics benchmark
We built this commercial cleaning franchise unit financial model using deep industry research to ensure your projections are grounded in reality. Key assumptions like the 11.5% royalty fee, $745,000 year-one revenue, and $212,000 in initial equipment and fees are pre-populated and fully editable. This tool helps you visualize how a $70,000 first-year EBITDA can scale into a high-performing $885,000 operation by year five.
The unit is projected to reach profitability in year one, specifically hitting its break-even point by April 2026. After accounting for the 11.5% royalty and labor for a general manager and five techs, the model shows a steady climb from a $70,000 EBITDA in the first year to $885,000 by year five. High-margin specialized sanitation work is the engine that drives this growth.
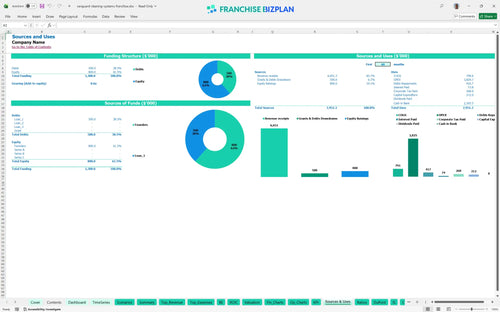
Launching this unit in the US requires an initial investment of roughly $212,000, covering the $5,000 franchise fee and significant equipment costs. The largest outlays are the $80,000 for cleaning vans and $35,000 for industrial machinery. Still, the model suggests a minimum cash position of $998,000 to defintely handle the ramp-up and working capital needs safely.
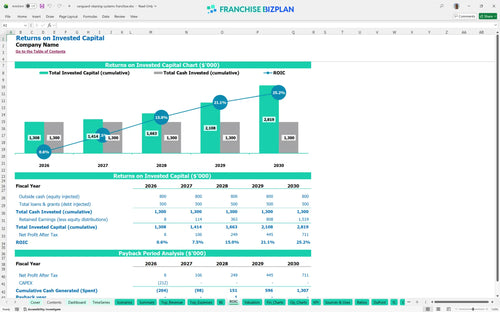
Investors can expect an Internal Rate of Return (IRR) of 5.96% and a Return on Equity (ROE) of 1.9. The payback period is approximately 3 years, which is standard for a service-based model with high upfront equipment costs. While the initial returns are modest, the year-five net margin makes the long-term hold attractive.
You hit the monthly break-even point just 4 months after launch, in April 2026. The primary driver for reaching this point is securing recurring janitorial contracts to cover the $3,200 monthly office lease and $8,600 in fixed insurance and software costs. Volume is your best friend when you are paying an 11.5% royalty on every dollar.
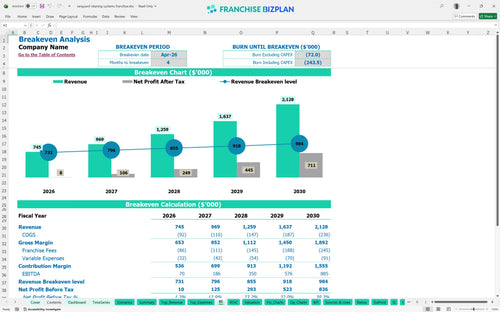
The lowest cash point occurs in May 2026, right as the full staff of five technicians and a manager are on the payroll. You need enough runway to cover the $15,000 initial inventory and the $10,000 startup marketing spend before the recurring revenue fully kicks in. Managing the timing of your $8,000 training expense is critical for liquidity.
In a high-growth scenario, focusing on medical-grade cleaning service franchise contracts can push year-one revenue well past the $745,000 mark. Conversely, a low-volume scenario where technician productivity drops could delay your 3-year payback significantly. The difference between the two usually comes down to your local marketing execution and retention of high-value biotech clients.
This commercial cleaning franchise financial model is built in Excel, allowing you to swap out every assumption to fit your specific territory. Whether you are adjusting for local labor rates or specific chemical costs, the pre-filled formulas handle the heavy lifting so you can focus on the strategy. It is a flexible tool designed to turn a generic janitorial franchise business plan template into a precise roadmap for your specific market. Every 1-point margin leak matters fast in a single-unit model.

Success in the service industry requires looking past the first few months of operation. This model provides a franchise unit financial projection spreadsheet that maps out five years of revenue, costs, and cash flow. You can see exactly how scaling from five to nine cleaning technicians impacts your store-level EBITDA as your volume grows from $745,000 to over $2.1 million. Planning for the long haul is the only way to ensure your growth is sustainable.

Royalties are a major part of the franchise reality, and this model treats them with the precision they deserve. We have baked in the 11.5% royalty fee calculation so you can see the direct impact on your monthly contribution margin. By tracking these ongoing obligations alongside your initial $5,000 fee, you get a transparent view of the total cost of being part of a national system. Don't let hidden fees eat your lunch.

Knowing how to calculate startup costs for a commercial cleaning franchise is the first step toward a successful launch. This model aggregates your $80,000 van purchase, $35,000 in industrial equipment, and $22,000 office fit-out to show your total entry cost. It then calculates the exact month you will stop burning cash and start generating a profit. Speed to break-even is the most important metric for any new owner.

We use built-in industry benchmarks to help you sanity-check your janitorial business operational expenses. If your cleaning supply costs are drifting above the projected 8.5%, the model flags it so you can investigate waste or theft. These benchmarks cover labor, rent, and supplies, ensuring your financial planning for medical-grade cleaning service franchise units stays grounded in real-world performance. Data beats guesswork every single time.


Simply purchase and download the financial model template, then access it instantly using Microsoft Excel or Google Sheets. No installation or technical expertise required-just open and start working.

Enter your business-specific numbers, including revenue projections, costs, and investment details. The pre-built formulas will automatically calculate financial insights, saving you time and effort.

Leverage the investor-ready format to confidently showcase your financial projections to banks, franchise representatives, or investors. Impress stakeholders with clear, data-driven insights and professional reports.

Leverage the investor-ready format to confidently present your projections to banks, franchise representatives, or investors.