
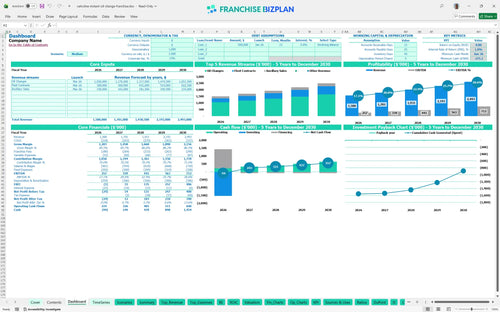
All-in-one Dashboard
Core inputs and core outputs


This Excel template for franchise unit cash flow forecasting provides a plug-and-play roadmap to manage everything from bay helpers to fleet maintenance contracts.
Core inputs and core outputs
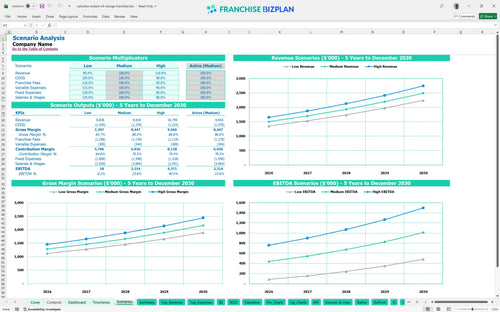
Three scenario analysis
Presentation ready
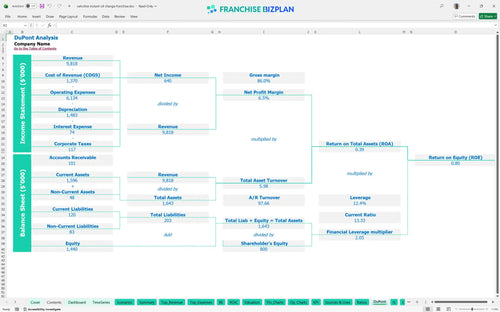
DuPont analysis
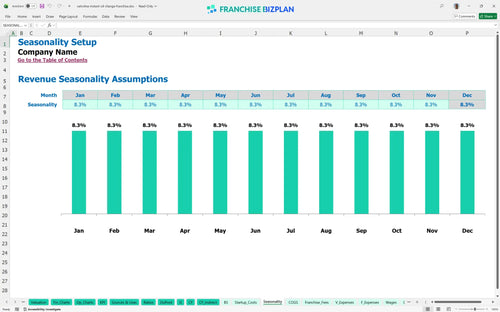
Researched revenue assumptions
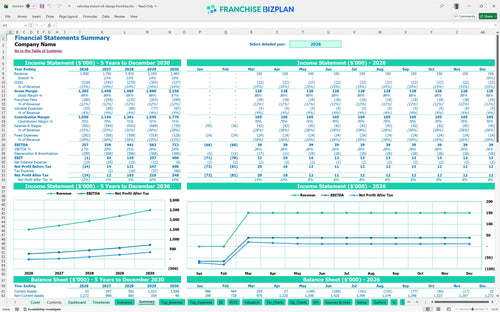
Lender-friendly financial outputs
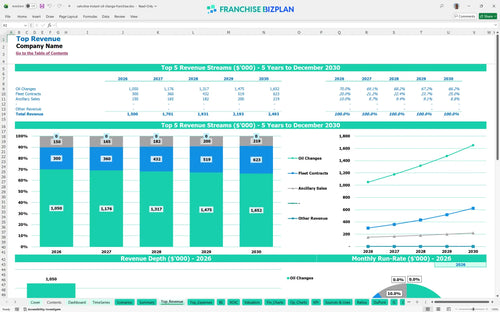
Revenue stream detailed view
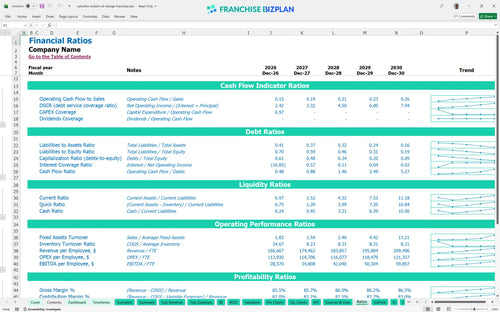
Performance metrics benchmark
We built this franchise unit financial model using our own research into high-volume automotive service centers. Key assumptions, including the $1.5M year-one revenue and 12% total royalty burden, are pre-populated with researched data and are fully editable. This tool helps you plan for the $15,000 monthly rent and the tech-heavy labor model required for a 15-minute service standard.
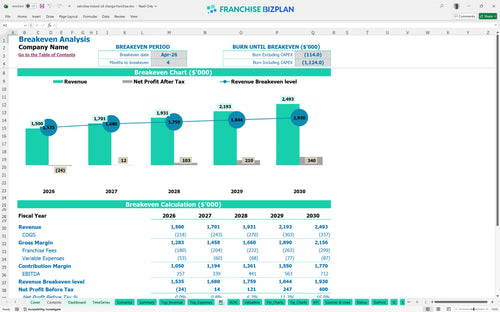
Based on the franchise unit profitability analysis, the shop reaches monthly profitability by April 2026. With EBITDA growing from $257,000 to $712,000 over five years, the trajectory is strong, provided you maintain the 15-minute service throughput and manage the 12% royalty load.
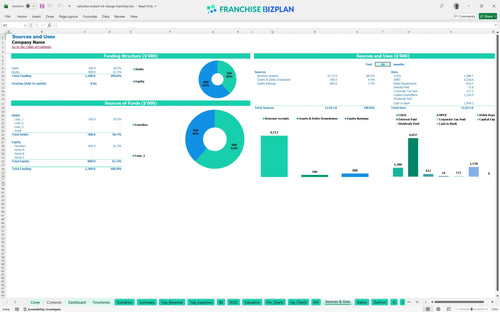
How to calculate startup costs for an automotive franchise starts with the $1.53M total investment. This includes $450,000 for leasehold improvements and $600,000 for bay equipment, which are the primary uses of your initial capital. You also need to budget for the $30,000 franchise fee and $120,000 in signage.
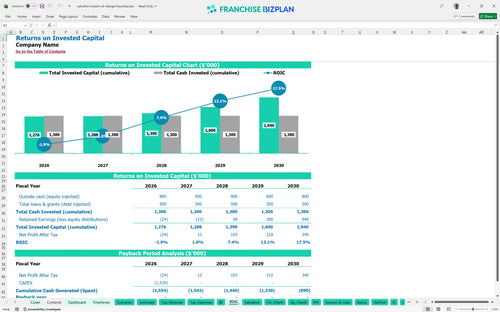
The ROI analysis for new franchise location indicates an IRR of 0.97% and a return on equity of 0.8. While the payback period extends after year 5, the long-term value lies in the $2.49M revenue potential and the stable $712,000 annual EBITDA engine you build by the fifth year of operation.
The break-even analysis for franchises shows you hit the point where revenue covers fixed costs in April 2026, just four months after launch. This is driven largely by your ability to how to forecast revenue for commercial fleet maintenance contracts and maintain high daily oil change volumes to cover the $15,000 monthly rent.
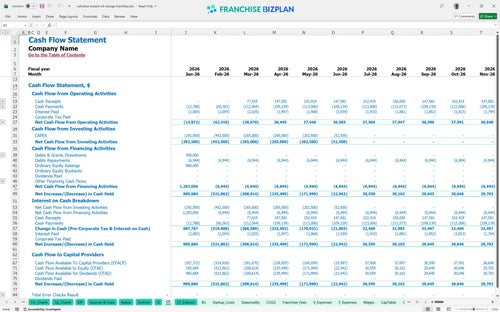
Your cash runway is tested in June 2026 when the balance hits -$275,000 during the ramp-up. A financial feasibility study for quick lube franchise units suggests keeping a cash buffer to manage the timing gaps between your $1.53M capital expenditure budget for new franchise unit and mature-unit performance.
Using the franchise unit EBITDA projection template, you can see how a 10% drop in volume affects your year-1 margin. To hit the high-case scenario of $2.49M in revenue, you must focus on local marketing execution and estimating labor costs for 15-minute oil change business efficiency to keep tech productivity high.
Finance: update unit break-even and payback model by Friday
This franchise financial model template is built in Excel, allowing you to tweak every variable from bay throughput to local labor rates. You can swap out the pre-filled assumptions for your specific territory to see how local rent and tech wages impact your bottom line. It is a flexible tool designed for both single-unit deep dives and multi-unit franchise financial planning.

Plan your expansion with a detailed 5-year outlook that tracks revenue scaling from $1.5M in year one to nearly $2.5M by year five. This quick lube franchise investment model helps you visualize how fleet contracts and ancillary sales compound over time to drive enterprise value. The model provides a clear view of your long-term cash flow and P&L trajectory.

Managing a 6% royalty and a 6% marketing fee is non-negotiable, so we built a franchise royalty fee calculation directly into the P&L. By accounting for the $30,000 initial fee and ongoing 12% top-line haircut, you get a realistic view of your actual take-home pay after the brand gets its cut. This ensures your franchise P&L statement reflects the true cost of brand affiliation.

Use this automotive franchise startup costs guide to map out your $1.53M initial investment, including the heavy $600,000 lift and bay equipment spend. The break-even analysis for franchises shows exactly when your daily car count covers the $15,000 monthly rent and high-performance labor costs. It is essential for understanding your margin and contribution levels during the ramp-up phase.

We defintely included industry-standard benchmarks so you can see if your 14.5% combined COGS for oil and filters aligns with top-performing shops. This automotive franchise financial performance benchmarking tool helps you spot margin leaks in your service model before they become cash flow crises. It provides the sanity checks needed for best practices for franchise operational expense management.


Simply purchase and download the financial model template, then access it instantly using Microsoft Excel or Google Sheets. No installation or technical expertise required-just open and start working.

Enter your business-specific numbers, including revenue projections, costs, and investment details. The pre-built formulas will automatically calculate financial insights, saving you time and effort.

Leverage the investor-ready format to confidently showcase your financial projections to banks, franchise representatives, or investors. Impress stakeholders with clear, data-driven insights and professional reports.

Leverage the investor-ready format to confidently present your projections to banks, franchise representatives, or investors.