
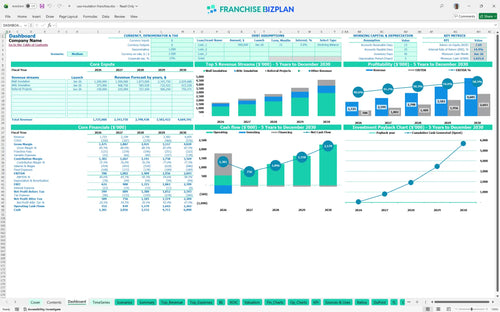
All-in-one Dashboard
Core inputs and core outputs


This product provides a complete financial model for insulation installation business owners, featuring integrated calculators for cash flow, payroll, and multi-year ROI.
Core inputs and core outputs
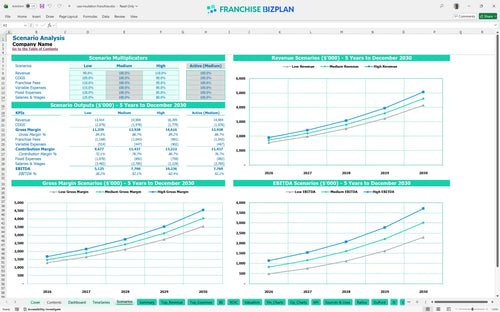
Three scenario analysis
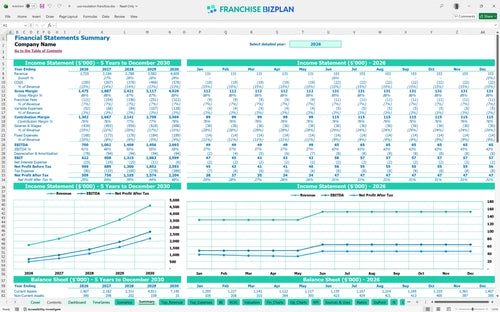
Presentation ready
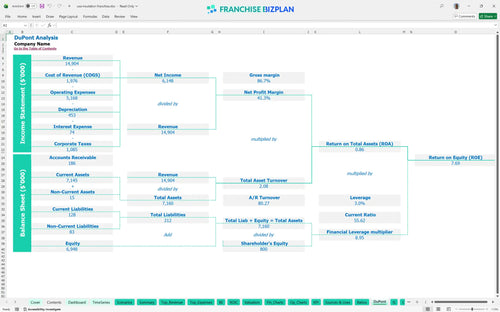
DuPont analysis
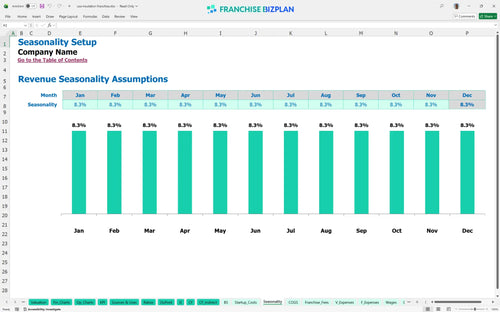
Researched revenue assumptions
Lender-friendly financial outputs

Revenue stream detailed view
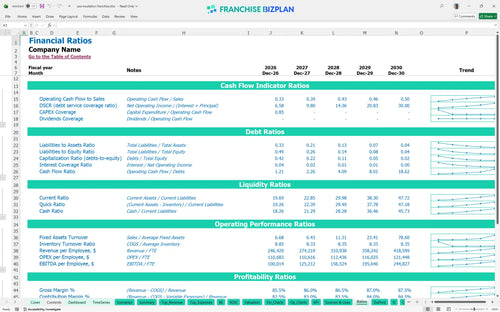
Performance metrics benchmark
We built this franchise unit financial model using our own research into the home performance sector. Key assumptions, including the $1.7M year-one revenue target and the 5% royalty structure, are pre-populated with researched data and are fully editable. This model helps you track everything from the $55,000 initial fee to the 14.94% internal rate of return.
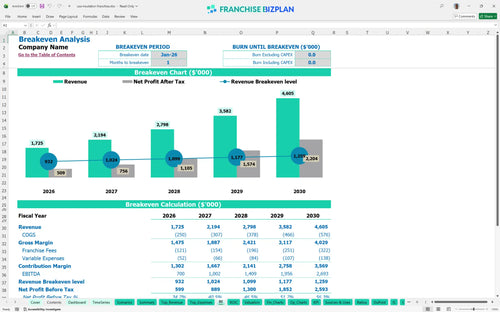
Based on the data, this unit hits a break-even date in January 2026, which is just one month after launch. With Year 1 EBITDA projected at $700,000, the model shows strong early earnings after accounting for the 5% royalty and 12.5% material costs. To be fair, early profitability depends on hitting your $800,000 wall insulation target in the first year.
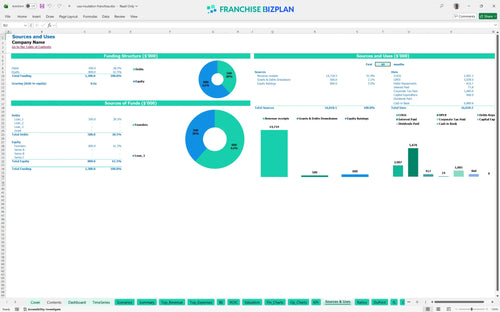
You need significant upfront capital to launch, with major outlays like $140,000 for leasehold improvements and $95,000 for service trucks. Total initial investment covers everything from the $55,000 franchise fee to $28,000 in starting inventory. Plus, you should account for the $15,000 office and IT setup costs during the first month.
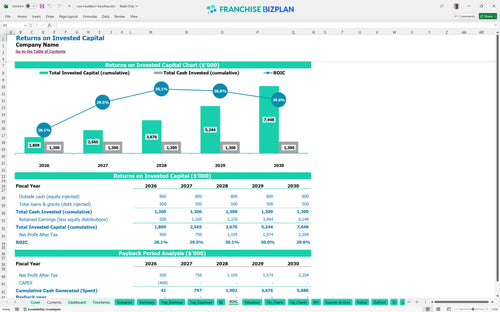
The model projects an Internal Rate of Return (IRR) of 14.94% and a Return on Equity (ROE) of 7.69%. Calculating ROI for home performance franchise units shows a payback period occurring after the five-year mark, despite high early EBITDA. What this estimate hides is the heavy initial CAPEX (capital expenditure) that takes time to recoup.
The monthly break-even happens almost immediately in January 2026, but staying there requires managing the $8,500 monthly rent and 1.5% referral commissions. Your volume of wall insulation jobs is the biggest driver for keeping the lights on. If opening takes 90+ days longer than planned, working capital pressure rises fast.
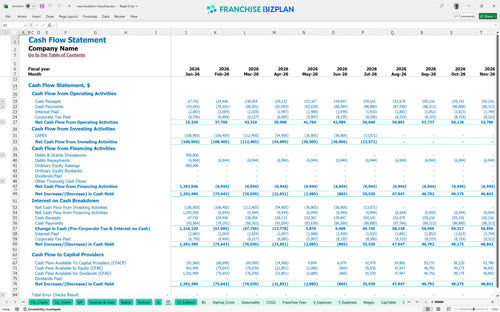
The lowest cash point is $1,025,000 in June 2026. You need to maintain a solid buffer because even though you're profitable, the timing of equipment payments and truck leases can tighten your cash position defintely. Managing your cash runway is about more than just sales; it is about timing your outflows.
Estimating profitability for home improvement franchises requires looking at different outcomes. A high-performance case moves you toward the $4.6M revenue mark faster, while a low-revenue scenario might delay your ability to hire the planned seven technicians by year five. Scenarios help you see how a 1-point margin leak affects your bottom line.
This franchise unit financial model template is built in Excel, allowing you to swap out variables like local labor rates or material costs. It uses pre-filled formulas so you can test different scenarios for a home service franchise financial projections without breaking the sheet. Honestly, having a flexible tool is the only way to handle the moving parts of a service business.

Planning a residential home service franchise financial template requires looking past the first year. This model tracks your growth from $1,725,000 in initial revenue up to $4,605,000 by year five, helping you visualize the scaling process. It is a trend-aware roadmap that connects your daily job volume to long-term wealth creation.

Analyzing franchise royalty fees and marketing costs is vital for protecting your margins. The model accounts for a 5% royalty and 2% marketing fee, ensuring these off-the-top costs are baked into your daily unit economics. Still, you need to watch these closely as they scale directly with your top-line growth.

Knowing how to calculate startup costs for an insulation franchise prevents mid-launch cash crunches. This tool performs a detailed break-even analysis, showing exactly when your monthly volume covers the $8,500 industrial rent and other fixed overhead. Here is the quick math: you need to know your floor before you can reach for the ceiling.

We use an Excel spreadsheet for franchise unit financial planning that includes industry-standard benchmarks. You can compare your $38,000 technician salaries or 12.5% material costs against typical home improvement margins to ensure your plan is realistic. It helps you spot if your labor spend is drifting too high before it eats your profit.


Simply purchase and download the financial model template, then access it instantly using Microsoft Excel or Google Sheets. No installation or technical expertise required-just open and start working.

Enter your business-specific numbers, including revenue projections, costs, and investment details. The pre-built formulas will automatically calculate financial insights, saving you time and effort.

Leverage the investor-ready format to confidently showcase your financial projections to banks, franchise representatives, or investors. Impress stakeholders with clear, data-driven insights and professional reports.

Leverage the investor-ready format to confidently present your projections to banks, franchise representatives, or investors.