
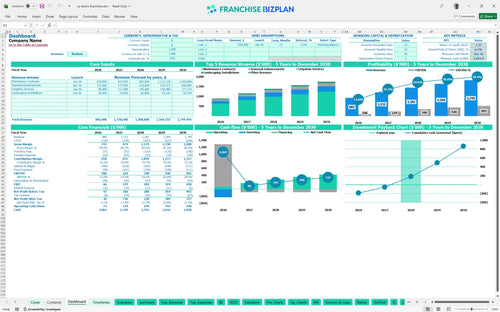
All-in-one Dashboard
Core inputs and core outputs


This Excel template for franchise unit cash flow forecasting provides a comprehensive roadmap for managing a commercial landscaping business from initial investment to long-term profitability. It is a complete roadmap.
Core inputs and core outputs
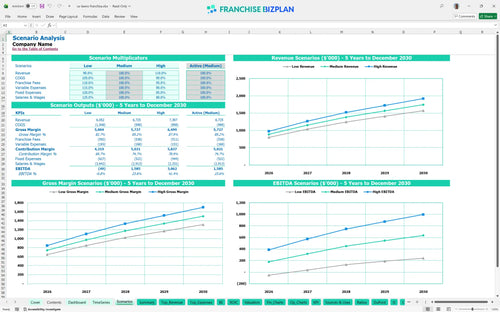
Three scenario analysis
Presentation ready
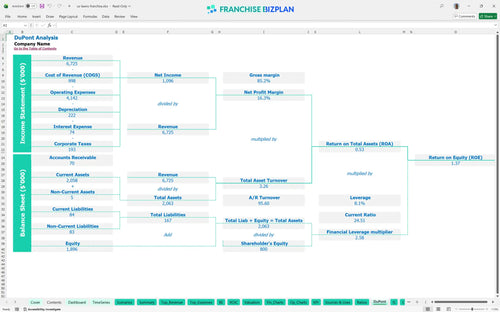
DuPont analysis
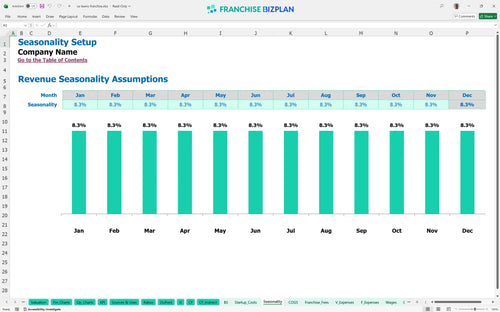
Researched revenue assumptions
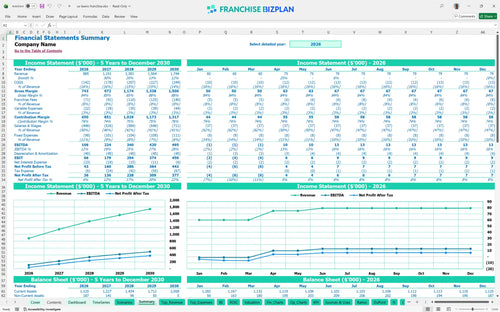
Lender-friendly financial outputs
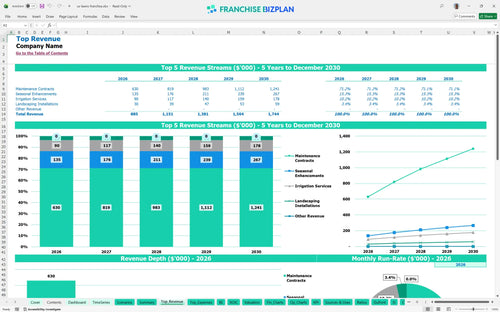
Revenue stream detailed view
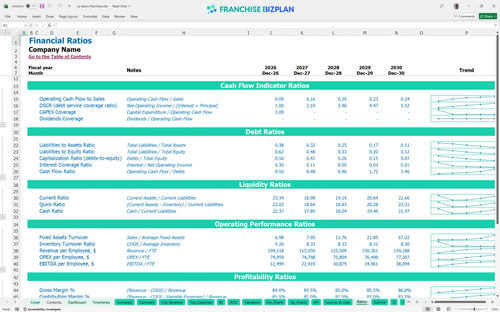
Performance metrics benchmark
We developed this financial model for commercial grounds maintenance service based on detailed research into the landscaping sector's unit economics. The pre-populated data includes a Year 1 EBITDA of $106,000 and a 3-year payback period, but you can edit every field to match your specific local labor rates and equipment quotes. Honestly, the recurring revenue model makes the cash flow much more predictable than one-off residential work.
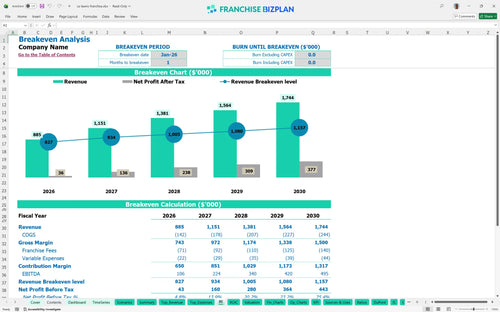
The model shows the unit hits break-even in January 2026, just one month after launch, thanks to the recurring revenue model of maintenance contracts. By Year 3, EBITDA is projected to reach $340,000 as you optimize labor and material costs. Profitability starts on day one.
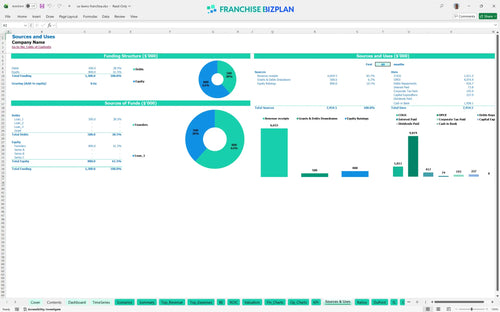
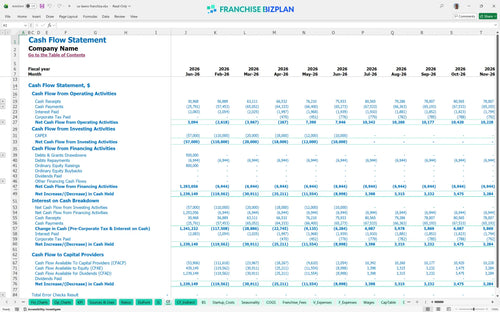
You will need a significant initial investment to cover the $49,000 franchise fee and $227,000 in total capital expenditures for trucks, mowers, and trailers. The lowest cash point hits $1,043,000 in June 2026, so having a solid cash buffer is defintely required for a smooth ramp-up. Cash is king during the build-out.
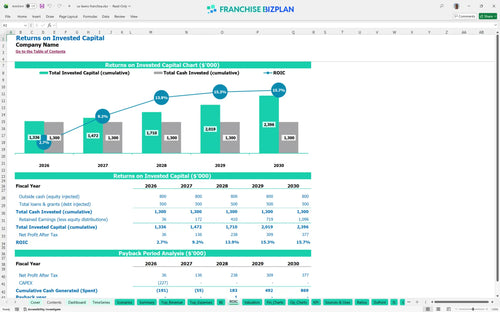
This model projects an Internal Rate of Return (IRR) of 6.05% and a Return on Equity (ROE) of 1.37. With a 3-year payback period, the unit offers a stable path to recovering your initial landscaping business startup costs through consistent commercial contracts. Your time is worth the return.
Break-even occurs in the first month of operations, provided you secure the projected $420,000 in maintenance contracts early on. The biggest driver for this is labor productivity, as crew wages for five members plus management total over $250,000 annually. Speed to break-even is everything.
Your lowest cash point is $1,043,000 in June 2026, which accounts for the initial equipment heavy-lift and the hiring of a full crew. You need enough runway to cover the $8,200 in monthly fixed costs, like rent and insurance, while your sales rep builds the pipeline. Watch the gap in June.
In a high-growth scenario, hitting $1.7 million in revenue by Year 5 significantly improves your ROI analysis for commercial landscaping franchise. Conversely, a low scenario where contracts ramp up slowly will delay your payback period and increase the total capital needed to stay afloat during the first winter. Plan for the best, prep for the rest.
Finance: update unit break-even and payback model by Friday
This commercial landscaping franchise model is built in Excel with open formulas, so you can adjust every assumption to fit your specific territory or market conditions. You can tweak the number of maintenance contracts or change the local fuel price to see how it hits your bottom line instantly. Every cell is open for your input.

Long-term planning is about more than just year one; this model maps out a five-year path from $885,000 in initial revenue to over $1.7 million. It tracks how your margins evolve as you add more crew members and scale your grounds management business plan across multiple commercial properties. Growth is a marathon, not a sprint.

We built in the specific 6% royalty and 2% marketing fund fees so you know exactly what goes to the franchisor every month. Understanding this franchise royalty and fee structure breakdown is vital because these costs scale directly with your revenue as you grow. Fees are the cost of brand power.

Use the franchise investment calculator to estimate your total initial outlay, including the $49,000 franchise fee and $75,000 for commercial trucks. The model identifies your break-even point, showing you exactly how many maintenance contracts you need to cover your fixed monthly costs like the $4,000 storage yard rent. Knowing your floor is step one.

We included industry-standard benchmarks for things like plants and materials, which start at 13% of revenue and scale down to 11% as you gain efficiency. This helps you sanity-check your operational expenses forecasting against real-world commercial property maintenance standards. Don't fly blind without benchmarks.


Simply purchase and download the financial model template, then access it instantly using Microsoft Excel or Google Sheets. No installation or technical expertise required-just open and start working.

Enter your business-specific numbers, including revenue projections, costs, and investment details. The pre-built formulas will automatically calculate financial insights, saving you time and effort.

Leverage the investor-ready format to confidently showcase your financial projections to banks, franchise representatives, or investors. Impress stakeholders with clear, data-driven insights and professional reports.

Leverage the investor-ready format to confidently present your projections to banks, franchise representatives, or investors.