
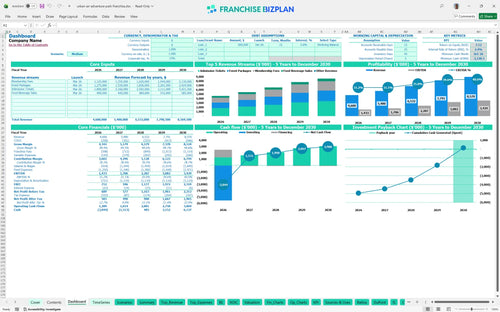
All-in-one Dashboard
Core inputs and core outputs


This franchise unit financial model template provides a complete Excel-based toolkit for forecasting revenue, managing expenses, and calculating investor returns for a large-scale entertainment venue.
Core inputs and core outputs
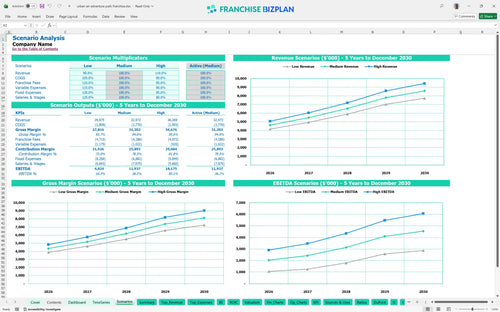
Three scenario analysis
Presentation ready
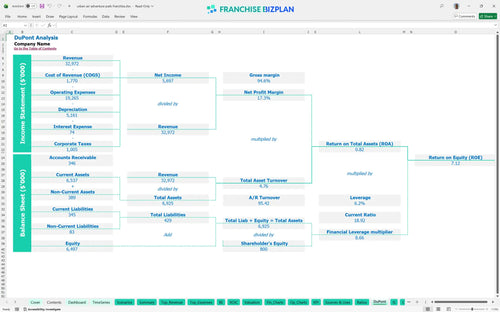
DuPont analysis
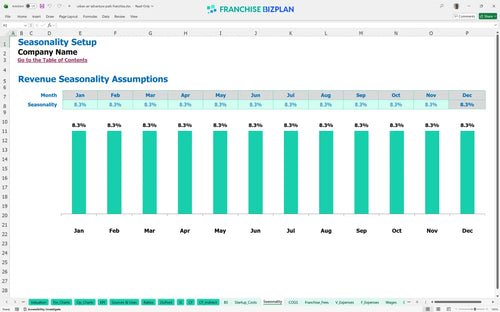
Researched revenue assumptions
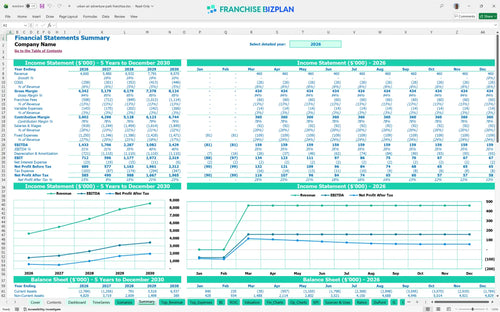
Lender-friendly financial outputs
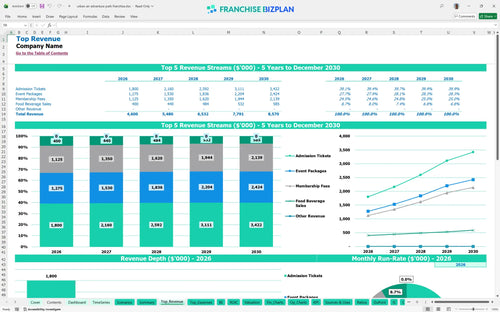
Revenue stream detailed view
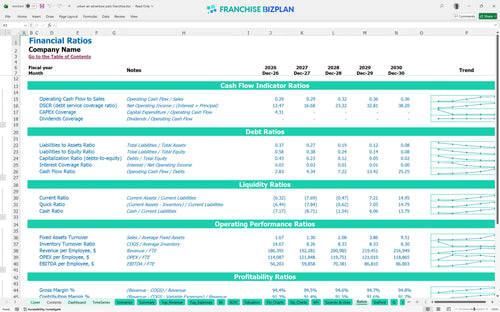
Performance metrics benchmark
We built this franchise unit financial model using our own research to help you navigate the unit economics analysis of a large-scale venue. Key assumptions like the $1.2M in admission tickets and $75,000 monthly rent are pre-populated with researched data specific to Urban Air Adventure Park Franchise franchise unit and are fully editable. This tool ensures your forecasting stays rooted in reality.
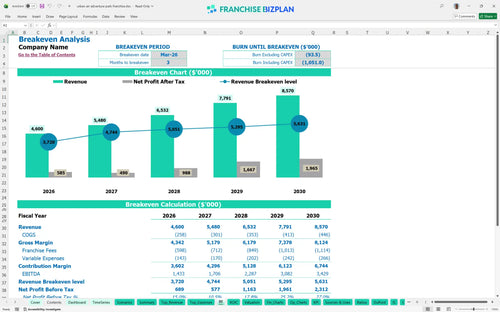
Based on the researched data, this unit hits its stride quickly, reaching break-even by March 2026, just three months after launch. With year-one EBITDA (earnings before interest, taxes, depreciation, and amortization) projected at $1,433,000, the model shows a steady climb as admission tickets and memberships scale. By year five, annual EBITDA is expected to reach $3,429,000. Profitability is a marathon, not a sprint.
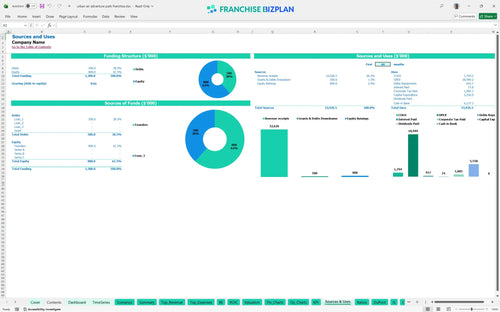
Launching this adventure park requires significant upfront capital, with the model showing a total investment across several major categories. Key outlays include $2,200,000 for leasehold improvements and $1,500,000 for attractions equipment. You also need to account for the $100,000 franchise fee and a $3,330,000 minimum cash need to cover the ramp-up and construction phase. Cash is king during the build-out.
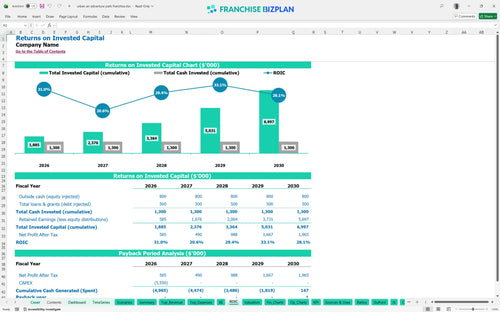
The financial model for family entertainment center franchise shows a 5-year payback period for the initial investment. With an Internal Rate of Return (IRR) of 2.45% and a Return on Equity (ROE) of 7.12%, the model reflects the capital-intensive nature of indoor amusement park startup costs. These figures help you assess if the long-term cash flow aligns with your portfolio goals. Your ROI depends on disciplined execution.
Calculating break-even point for indoor adventure park operations depends heavily on covering the $75,000 monthly facility rent and management salaries. The model indicates you hit the break-even date in March 2026. Your primary lever is volume; between admission tickets and event packages, you need consistent foot traffic to offset the high fixed occupancy costs. Volume is your best friend for break-even.
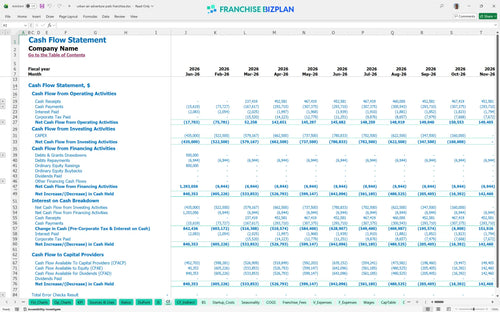
The lowest cash point occurs in October 2026, with a projected deficit of $3,330,000 before the unit stabilizes. This means you need a substantial capital reserve or financing plan to survive the construction and initial opening months. Managing the timing of the $800,000 Sky Rider installation and $2.2M build-out is critical to maintaining liquidity. Watch the October cash dip closely.
The excel template for franchise unit financial forecasting allows you to toggle between Low, Medium, and High cases to see how revenue changes impact the bottom line. A 10% drop in admission tickets can significantly delay your 5-year payback, while hitting the High case through better local marketing execution can pull your break-even forward. Scenarios help you prepare for the worst.
This indoor trampoline park franchise financial model is built in Excel, allowing you to tweak every variable from ticket prices to hourly wages. Since every territory has different labor rates and rent, the pre-filled formulas ensure your math stays accurate while you test different scenarios. It is a plug-and-play tool that handles the heavy lifting of complex calculations so you can focus on the strategy. It's a plug-and-play tool for complex math.

Success in a family entertainment center business plan template requires looking past the grand opening. This franchise financial projection spreadsheet provides a full 60-month outlook on revenue, costs, and cash flow, capturing the ramp-up phase and long-term stabilization. You can see how year-over-year growth in memberships affects your bottom line as the unit matures. Long-term planning beats short-term guessing.

Analyzing franchise royalty and fee structures is critical because these costs come off the top and impact your store-level margin. The model calculates the 7% royalty and 6% marketing fee based on your gross sales, ensuring you see the true net profit after brand obligations. It also accounts for the initial $100,000 franchise fee, so your startup capital is correctly allocated from day one. Royalties are a reality you must model.

Knowing how to estimate startup costs for an indoor trampoline park is the first step to avoiding a cash crunch. This model aggregates leasehold improvements, equipment, and pre-opening expenses to show your total entry cost. It then identifies the exact sales volume needed to cover your $75,000 monthly rent and other fixed overhead. Knowing your number keeps the doors open.

Use this franchise unit profitability analysis to see how your labor and food costs stack up against industry standards. With pre-set categories for court attendants and cafe staff, you can ensure your staffing levels match the expected throughput of a 45,000-square-foot facility. It acts as a sanity check for your operating budget template for franchise owners. Benchmarks keep your assumptions grounded.


Simply purchase and download the financial model template, then access it instantly using Microsoft Excel or Google Sheets. No installation or technical expertise required-just open and start working.

Enter your business-specific numbers, including revenue projections, costs, and investment details. The pre-built formulas will automatically calculate financial insights, saving you time and effort.

Leverage the investor-ready format to confidently showcase your financial projections to banks, franchise representatives, or investors. Impress stakeholders with clear, data-driven insights and professional reports.

Leverage the investor-ready format to confidently present your projections to banks, franchise representatives, or investors.