
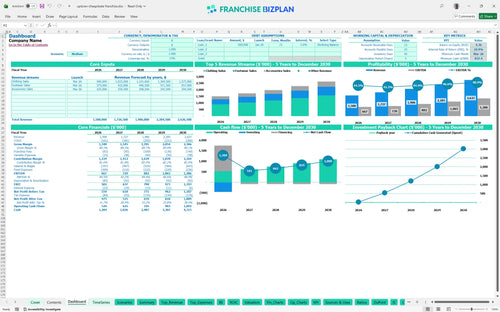
All-in-one Dashboard
Core inputs and core outputs


This comprehensive tool provides a dynamic Excel-based framework for forecasting revenue, managing expenses, and analyzing the long-term ROI of a retail franchise unit.
Core inputs and core outputs
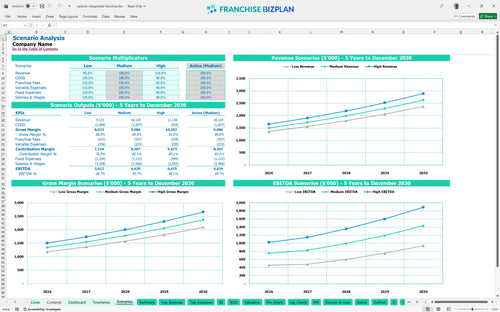
Three scenario analysis
Presentation ready
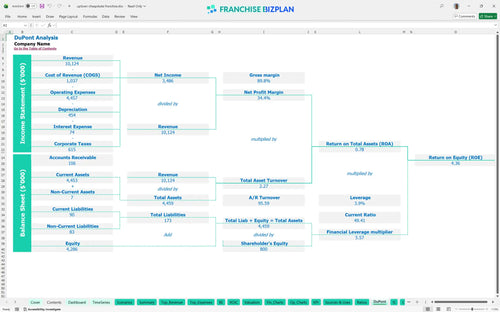
DuPont analysis
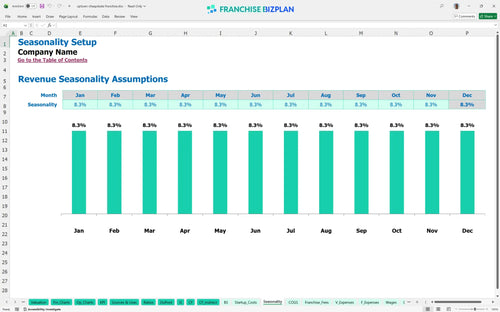
Researched revenue assumptions
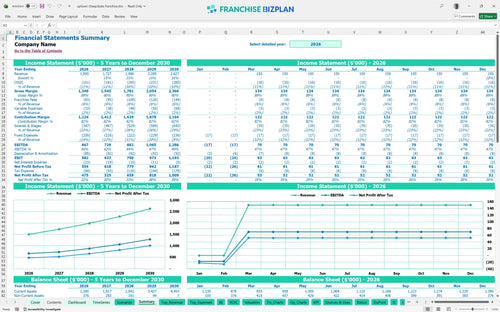
Lender-friendly financial outputs
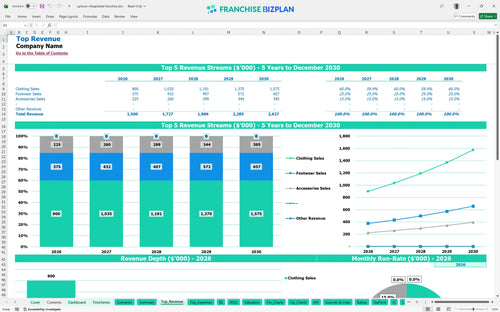
Revenue stream detailed view
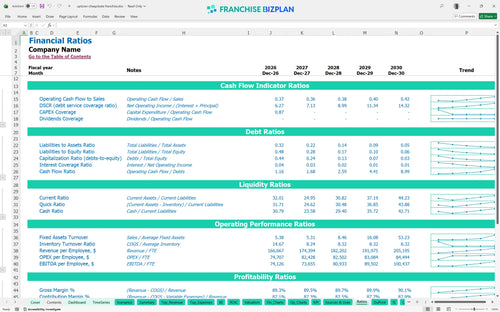
Performance metrics benchmark
We built this franchise unit financial model using our own research into the resale clothing sector to provide a realistic starting point. The pre-populated data includes a Year 1 revenue target of $1,500,000 and an EBITDA of $667,000, which you can adjust based on your specific Austin or local market conditions. This franchise P&L statement is fully editable, allowing you to refine every line item from influencer commissions to security costs.
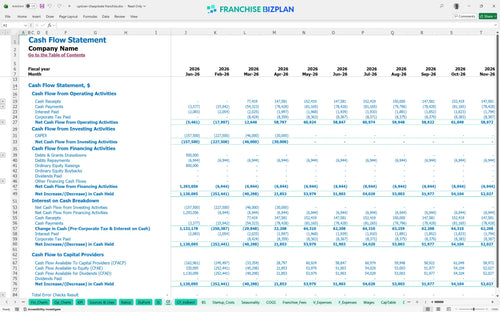
The unit shows strong early performance with a Year 1 EBITDA of $667,000, indicating immediate operational profitability after opening in March 2026. This retail store cash flow projection assumes you hit your sales targets for clothing and footwear while keeping inventory costs under 10%. Profitability stays consistent as revenue scales toward $2.6 million by the fifth year.
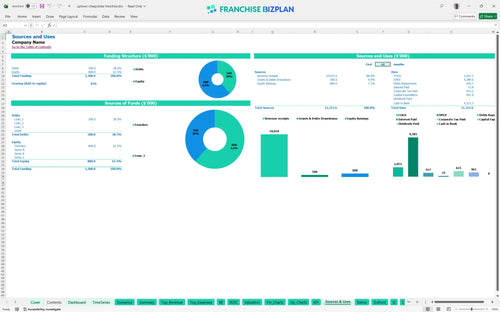
To launch this unit, you need approximately $461,000 in total CAPEX, which is tracked via our franchise ROI calculator. This includes the $25,000 franchise fee, $265,000 for build-out, and $60,000 for the initial inventory to fill the racks. You also need to account for the $837,000 minimum cash requirement to handle the ramp-up phase safely.
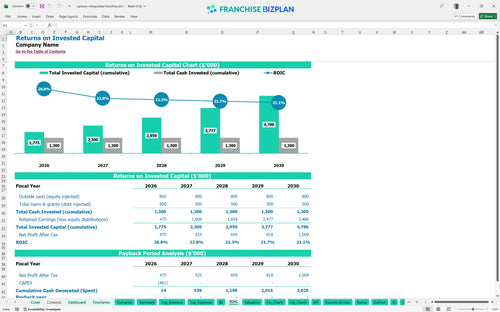
The model projects an Internal Rate of Return (IRR) of 10.93% and a Return on Equity (ROE) of 4.36. While the store is operationally profitable quickly, the full payback of the initial investment occurs after Year 5 due to the high initial cash requirement. These resale shop operating expenses are significant, but the high annual EBITDA helps sustain the long-term investment case defintely.
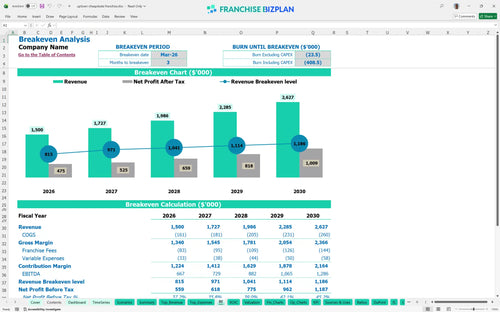
Using this franchise unit financial forecasting tool, the break-even date is identified as March 2026, just three months after the initial setup begins. The primary driver for reaching this point is the $1,500,000 Year 1 revenue target, which must cover the $11,500 monthly rent and $2,300 in utilities. If sales volume dips, the 5.5% combined royalty and marketing fee becomes a heavier burden on your margins.
The lowest cash point occurs in March 2026 at $837,000, which represents the critical window where startup costs and initial operating losses peak. Knowing how to calculate startup costs for a retail franchise is vital here so you don't run dry before the sales ramp up. You should maintain a buffer to cover the $11,500 rent and the $68,000 manager salary during the first few months of trading.
This financial model template for resale clothing store allows you to toggle between growth paths to see how they affect your $1.5M base revenue. A high-performance scenario might accelerate the 10.93% IRR, while a low-sales year would delay the payback period beyond the current five-year estimate. The model shows that even with 5% royalties, the store-level margin remains resilient if you manage the 33% year-over-year revenue growth effectively.
Finance: update unit break-even and payback model by Friday
This franchise financial model template is built in Excel to give you total control over your unit-level planning. You can swap out pre-filled research for your own local data, adjusting everything from clothing sales growth to specific utility costs. It is a flexible tool that handles the heavy lifting of math so you can focus on the strategy of your retail rollout.

Planning for a resale shop requires a long-term view of how inventory and labor scale together. This model provides a full 5-year outlook, showing your revenue climbing from $1.5 million in Year 1 to over $2.6 million by Year 5. It maps out the retail franchise startup costs and tracks how your margins evolve as the store matures in its market.

Your franchise business plan Excel must account for the specific costs of brand membership. This model automatically calculates the 5% royalty and 0.5% marketing fee against your projected sales of clothing, footwear, and accessories. It ensures you see the exact dollar amount leaving the business before you pay your own local bills.

Launching a clothing resale franchise investment involves significant upfront capital, including $265,000 for leasehold improvements and $60,000 for initial inventory. This tool aggregates every expense from the $25,000 franchise fee to the $18,000 for signage. It tells you exactly when your daily sales volume finally covers your $11,500 monthly rent and other fixed overhead.

We have integrated realistic benchmarks into this franchise unit profitability analysis to keep your projections grounded. For instance, inventory purchases are modeled starting at 9.5% of revenue, while labor includes a $68,000 manager salary and a team of sales associates. These numbers help you compare your expected performance against standard resale industry norms.


Simply purchase and download the financial model template, then access it instantly using Microsoft Excel or Google Sheets. No installation or technical expertise required-just open and start working.

Enter your business-specific numbers, including revenue projections, costs, and investment details. The pre-built formulas will automatically calculate financial insights, saving you time and effort.

Leverage the investor-ready format to confidently showcase your financial projections to banks, franchise representatives, or investors. Impress stakeholders with clear, data-driven insights and professional reports.

Leverage the investor-ready format to confidently present your projections to banks, franchise representatives, or investors.