


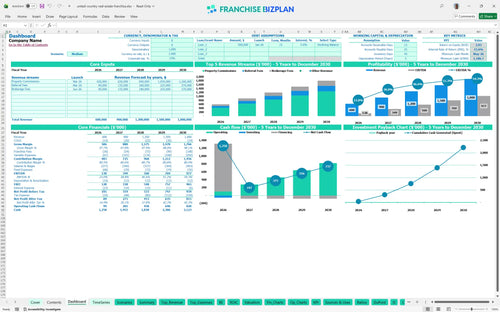
All-in-one Dashboard
Core inputs and core outputs



This real estate franchise investment analysis tool provides a complete Excel-based framework for forecasting commissions, managing agent payroll, and tracking franchise royalties over a five-year horizon.
Core inputs and core outputs
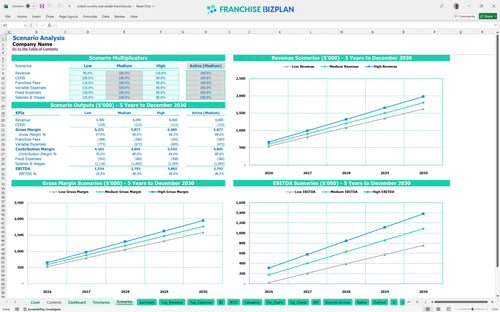
Three scenario analysis
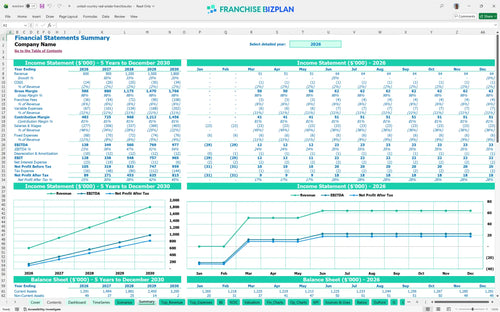
Presentation ready
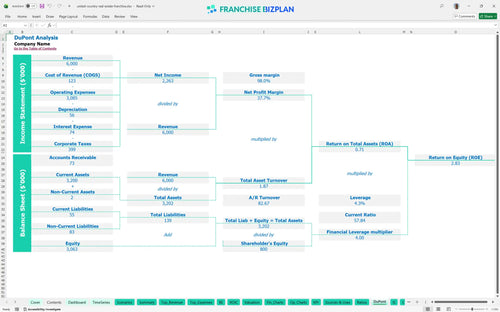
DuPont analysis
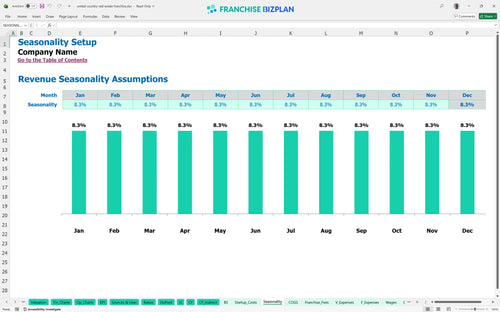
Researched revenue assumptions
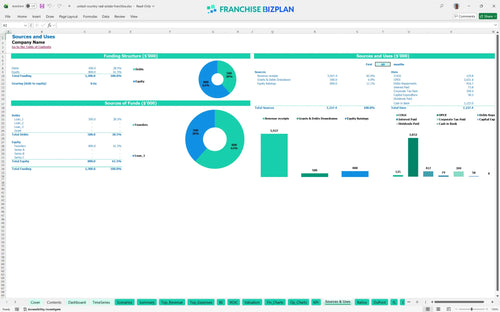
Lender-friendly financial outputs
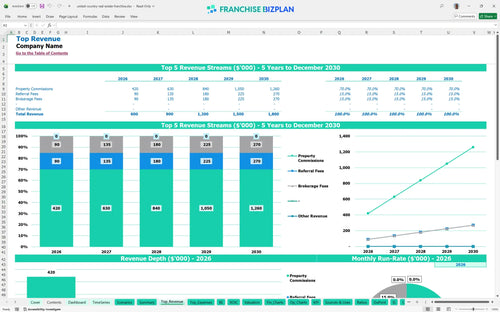
Revenue stream detailed view
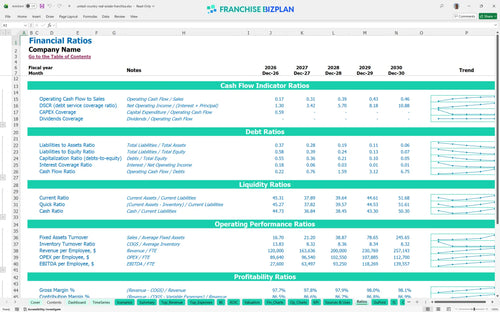
Performance metrics benchmark
We built this franchise unit economic modeling tool using researched data to ensure your projections for this specialized rural property brokerage are grounded in reality. Key assumptions, including the $600,000 year-one revenue and the $1,187,000 minimum cash requirement, are pre-populated and fully editable to match your specific territory and growth plans. This data-driven approach helps you move from a business idea to a functional financial plan with confidence.
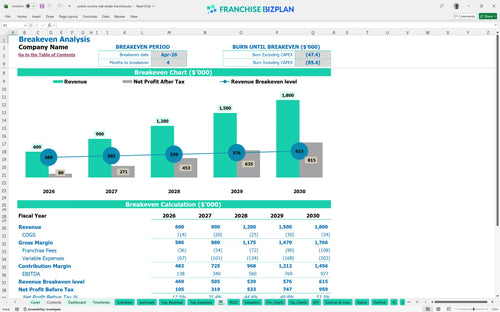
The unit reaches its break-even point in April 2026, just four months after launching operations. With a year-one EBITDA of $138,000 scaling to $977,000 by year five, the model shows a strong profitability trajectory once the initial startup phase and agent recruitment are complete.
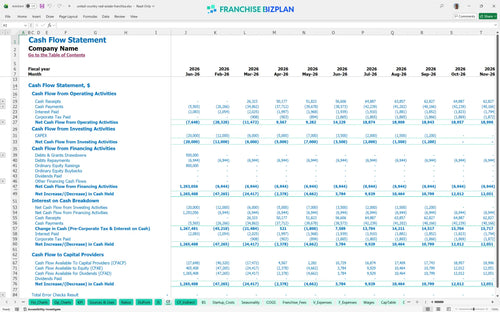
How to calculate startup costs for a real estate franchise starts with the $58,200 needed for the initial fee and equipment, plus a significant cash buffer. The minimum cash needed is $1,187,000, which covers the high-touch operational overhead and working capital until the $600,000 in year-one revenue fully ramps up.
The real estate franchise ROI analysis Excel shows an Internal Rate of Return (IRR) of 15.64% and a Return on Equity (ROE) of 2.83. While the unit generates nearly $1 million in annual EBITDA by year five, the total payback period extends beyond the first five years due to the substantial initial working capital requirements.
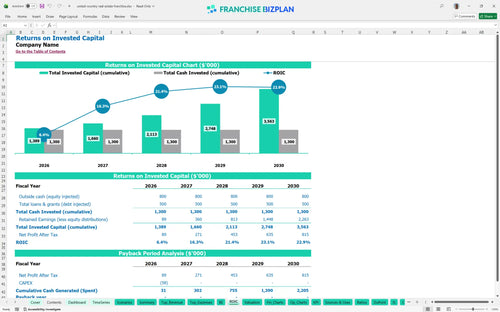
The monthly break-even point is reached in month 4, driven by property commissions covering $5,650 in fixed monthly costs and roughly $20,000 in monthly base salaries. Managing the 10% agent splits and 6% royalty fee is critical to maintaining store-level margin during the ramp-up period.
The lowest cash point occurs in May 2026, requiring a minimum cash balance of $1,187,000 to ensure the business stays liquid during the initial growth phase. This runway is essential to cover the $205,000 in annual base wages for the managing broker and support staff before the $1.8 million year-five revenue target is realized.
High-revenue scenarios for a luxury ranch real estate agency significantly improve the 15.64% IRR by leveraging fixed costs across more transactions. Conversely, a low-revenue scenario would defintely strain the $1,187,000 cash buffer, as fixed expenses like the $48,000 marketing coordinator salary remain constant regardless of commission volume.
Finance: update unit break-even and payback model by Friday.
This real estate franchise financial model is built in Excel, allowing you to modify every variable to match your specific market conditions. It features pre-filled formulas for commission-based revenue projections and agent splits, but you can easily adjust these based on local competition or high-end property trends. Whether you are forecasting for a mountain resort town or a rural farming community, the editable assumptions for rent, staffing, and marketing spend let you stress-test your business plan before signing a lease.

Success in a brokerage requires looking past the first few closings to see how the office scales over several years. This real estate brokerage business plan template forecasts revenue growing from $600,000 in year one to $1.8 million by year five as your agent count and local market share expand. By mapping out five years of cash flow and EBITDA, you can see exactly how much capital you need to survive the ramp-up phase and when the office starts generating significant owner benefit.

The model accurately captures the financial obligations of the franchise royalty fee structure, including the 6% royalty on gross revenue. It tracks the initial $20,000 franchise fee as a startup cost while calculating ongoing monthly payments so you can see your true store-level margin. Since this model currently reflects a 0% brand marketing fund contribution, you can easily see how that lack of an extra fee impacts your bottom-line profitability compared to other national brands.

You need to know exactly how much cash to bring to the table, and this franchise startup cost spreadsheet totals your investment at approximately $58,200 for physical assets and fees. The break-even analysis shows you need to hit your stride by April 2026-just four months in-to cover fixed costs like the $3,500 monthly rent and $20,000 in monthly base wages. It defintely helps to see the exact sales volume required to stop burning cash and start building equity in your territory.

We have incorporated realistic benchmarks for a niche real estate office, from the 10% agent split assumptions to the 1.2% processing fees. These numbers act as a sanity check, ensuring your projections for videography costs and listing fees align with high-end brokerage standards. Comparing your expected $138,000 year-one EBITDA against these benchmarks helps you spot if your real estate brokerage operational overhead is too heavy or if your revenue targets are too aggressive.


Simply purchase and download the financial model template, then access it instantly using Microsoft Excel or Google Sheets. No installation or technical expertise required-just open and start working.

Enter your business-specific numbers, including revenue projections, costs, and investment details. The pre-built formulas will automatically calculate financial insights, saving you time and effort.

Leverage the investor-ready format to confidently showcase your financial projections to banks, franchise representatives, or investors. Impress stakeholders with clear, data-driven insights and professional reports.

Leverage the investor-ready format to confidently present your projections to banks, franchise representatives, or investors.