
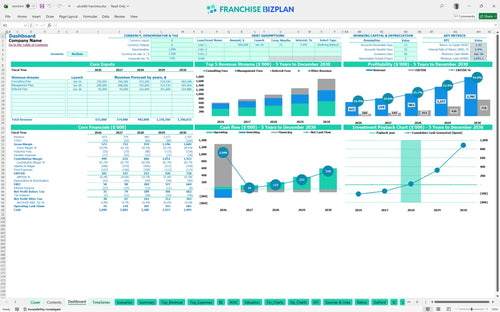
All-in-one Dashboard
Core inputs and core outputs


This comprehensive toolkit provides a detailed franchise P&L statement, capital expenditure budget, and cash flow projections designed specifically for a residential construction management business.
Core inputs and core outputs
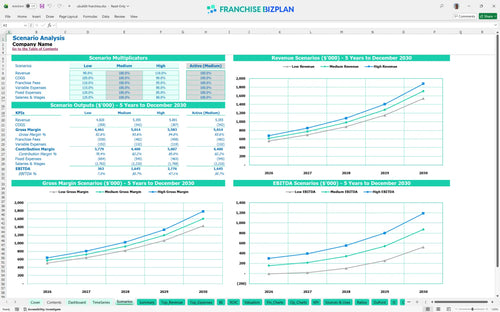
Three scenario analysis
Presentation ready
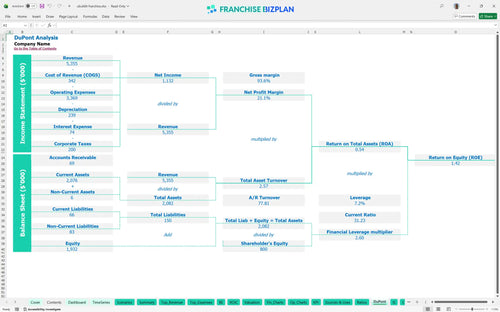
DuPont analysis
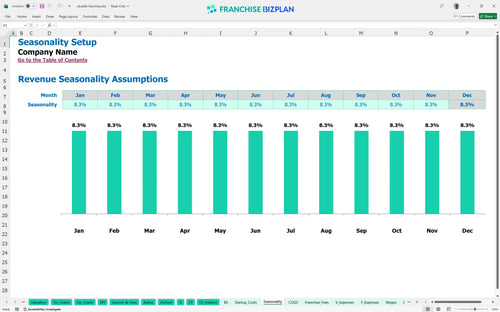
Researched revenue assumptions
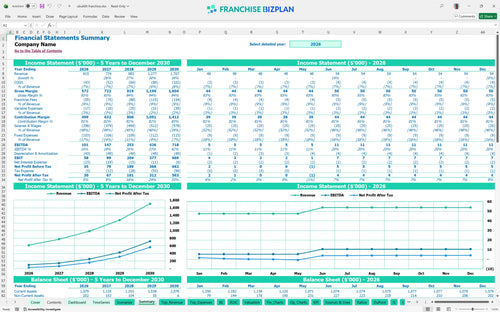
Lender-friendly financial outputs
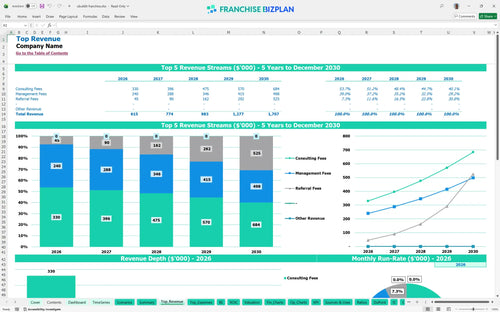
Revenue stream detailed view
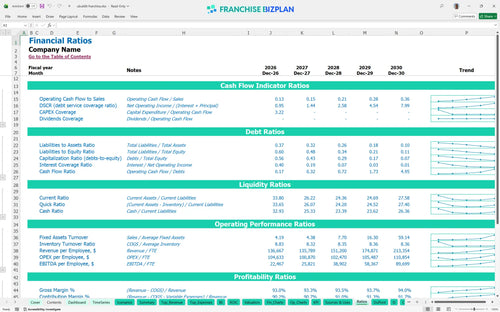
Performance metrics benchmark
We built this franchise unit financial model based on deep research into the owner-builder construction sector. The model includes pre-populated assumptions for consulting fees starting at $220,000 and management fees of $160,000, which are fully editable to match your local market. With a projected Year 1 EBITDA of $101,000 and a 3-year payback period, this tool gives you the data-driven clarity needed for a serious franchise investment analysis.
The unit hits profitability almost immediately, with Year 1 EBITDA projected at $101,000 and scaling to $718,000 by Year 5. This growth is driven by a mix of consulting, management, and referral fees that outpace the modest 7% royalty and 2% marketing fund contributions. Analyzing net profit margins for service-based franchises like this shows that profitability depends on maintaining low subcontractor cost percentages as volume increases.
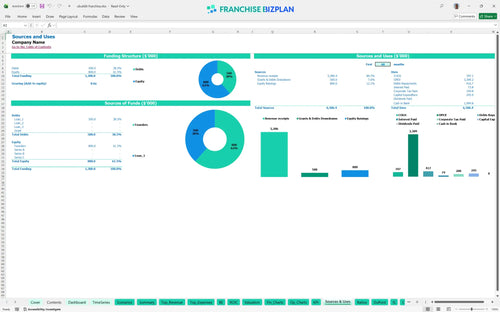
You need approximately $245,000 in upfront capital for CAPEX, plus a significant cash buffer to reach the $1,041,000 minimum cash requirement. The primary uses of funds include a $75,000 office fitout, a $45,000 site visit vehicle, and the $35,000 initial franchise fee. This allocation ensures you have the professional presence and mobility required to serve affluent clients in the custom luxury housing market.
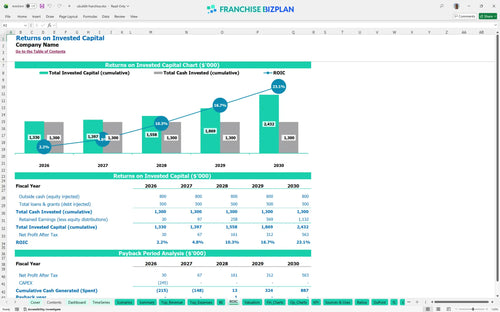
Investors can expect a 5.36% IRR and a 3-year payback period on their initial equity investment. Calculating return on investment for new franchise unit locations shows a Return on Equity (ROE) of 1.42, reflecting the steady cash flow generated by the service-heavy revenue model. While the IRR is conservative, the cash flow stability from management fees provides a reliable floor for multi-unit operators.
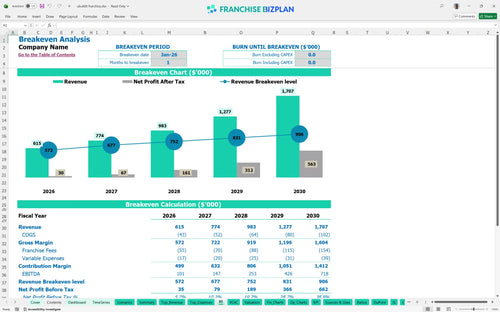
Break-even occurs in January 2026, which is just one month after launch, assuming you have secured your initial consulting contracts. The key driver for this rapid break-even is the low variable cost structure, but it remains sensitive to your $5,500 monthly rent and the $85,000 principal consultant salary. If project materials or subcontractor costs exceed 7% of revenue, your margin for error narrows quickly.
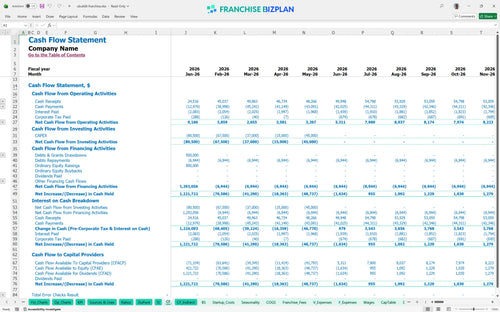
The lowest cash point is $1,041,000 in June 2026, meaning you need substantial liquidity during the first six months of operation. This franchise unit cash flow projection template highlights that even with early break-even, the timing of hiring a full team can strain your reserves. It is defintely wise to maintain a cash buffer to cover the $23,000+ monthly payroll before your referral fees fully ramp up in the second half of Year 1.
Building a financial model for an owner-builder franchise requires stress-testing; a 20% drop in revenue in the Low case pushes the payback period past 4 years and slashes Year 1 EBITDA. In the High scenario, increased consultant productivity and higher referral fee density can double your Year 5 EBITDA. Best practices for franchise unit financial forecasting suggest that your ability to manage the $60,000 project consultant salaries against actual project volume is the biggest variable.
This franchise financial model is built in Excel so you can tweak every variable for your specific territory. It includes pre-filled formulas for construction management franchise operations, allowing you to adjust how to calculate franchise startup costs in Excel without breaking the logic. You can change the timing of your office fitout or the ramp-up of your consulting fees to see how it hits your bottom line. It is defintely designed for owners who want to test what-if scenarios before signing a lease.

Planning for long-term growth is easier with a franchise business plan template that scales from Year 1 revenue of $615,000 to Year 5 projections of $1,707,000. This financial model template for construction management franchise units provides a clear view of your P&L, balance sheet, and cash flow over sixty months. These projecktions help you visualize the transition from a single principal consultant to a full team of five project consultants as your local market density increases.

Managing your royalty fee structure is vital for long-term survival in the owner-builder space. This tool automates estimating royalty payments for franchise business plan needs by applying a 7% royalty and a 2% marketing fee against your projected revenue streams. By tracking these obligations alongside your $35,000 initial fee, you get a clear view of the total cost of brand alignment. It helps you see exactly how much cash stays in your pocket after the franchisor takes their cut.

Our franchise startup cost calculator breaks down the $245,000 in required CAPEX, from the $75,000 office fitout to the $45,000 site visit vehicle. By identifying these fixed costs early, you can use the startup budget template for residential construction business units to find your exact break-even point. The model shows you how many consulting contracts you need to sign each month to cover your $5,500 rent and $23,000+ monthly payroll.

This franchise feasibility study template for entrepreneurs includes operational expense forecasting based on real-world construction management data. We have baked in benchmarks for project materials at 2.5% and subcontractor costs that start at 4.5% of revenue. These targets help you sanity-check your local estimates against best practices for franchise unit financial forecasting. It ensures your margins stay healthy even as you add administrative and sales support staff.


Simply purchase and download the financial model template, then access it instantly using Microsoft Excel or Google Sheets. No installation or technical expertise required-just open and start working.

Enter your business-specific numbers, including revenue projections, costs, and investment details. The pre-built formulas will automatically calculate financial insights, saving you time and effort.

Leverage the investor-ready format to confidently showcase your financial projections to banks, franchise representatives, or investors. Impress stakeholders with clear, data-driven insights and professional reports.

Leverage the investor-ready format to confidently present your projections to banks, franchise representatives, or investors.