
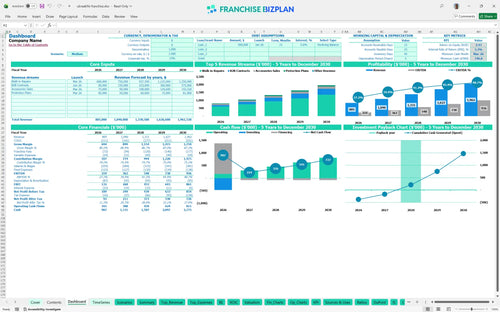
All-in-one Dashboard
Core inputs and core outputs


This franchise unit financial model template provides a complete Excel-based framework for forecasting revenue, managing complex technician payroll, and tracking the 3-year payback period for a tech repair storefront.
Core inputs and core outputs
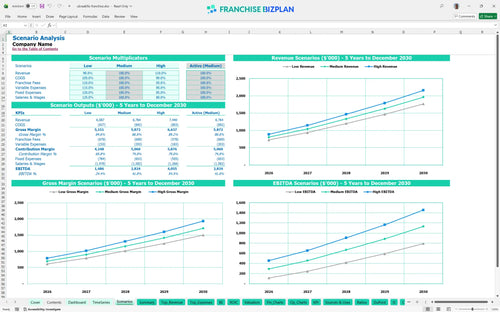
Three scenario analysis
Presentation ready
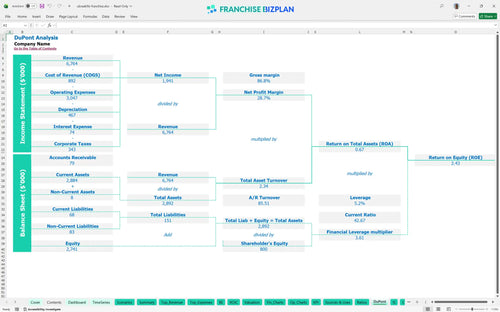
DuPont analysis
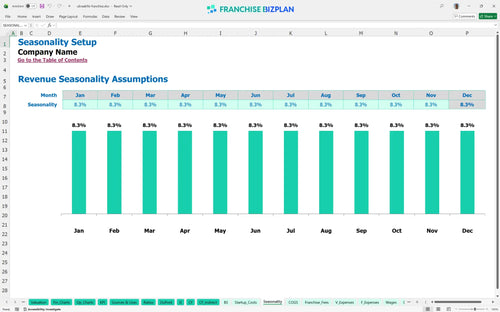
Researched revenue assumptions
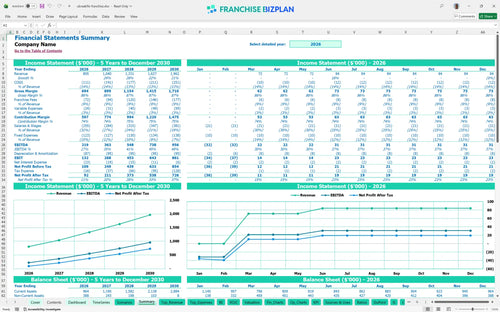
Lender-friendly financial outputs
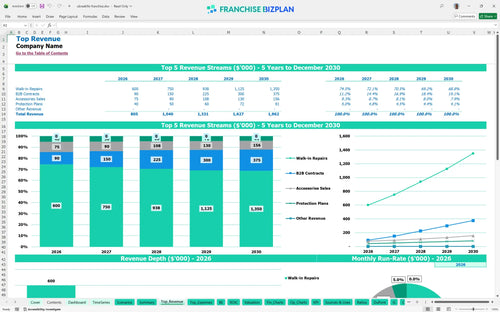
Revenue stream detailed view
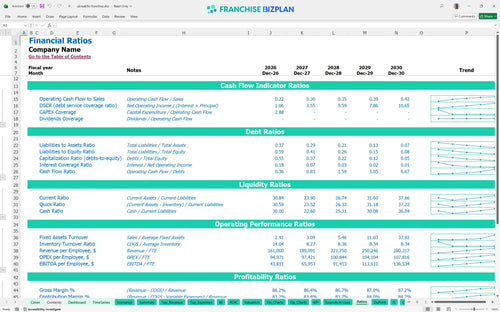
Performance metrics benchmark
This model was built using detailed research into the electronics repair sector to ensure your projections are defensible. We have pre-populated the data with a $40,000 franchise fee and a 7% royalty rate, showing an EBITDA of $219,000 in the first year. These assumptions are fully editable, allowing you to defintely adjust for local labor rates or specific B2B contract wins.
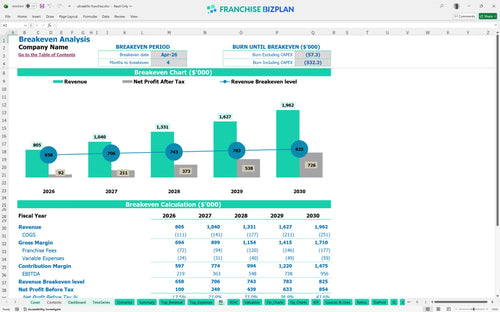
You can expect the unit to reach operational profitability by April 2026, just four months after the January launch. Total year-one EBITDA is projected at $219,000, but true bottom-line health depends on keeping parts costs at the 12% target and managing the 2% payment processing fees.
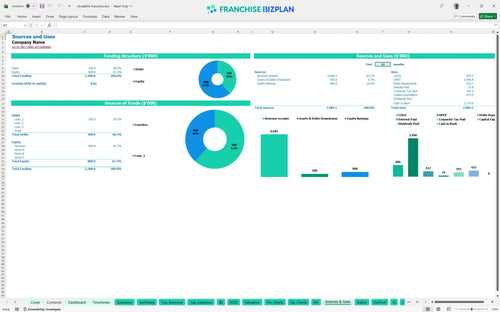
You will need approximately $475,000 to get the doors open, covering everything from the $40,000 initial fee to $80,000 in specialized repair tools. The model assumes you are funding this through a mix of equity and debt, with the largest chunk-$200,000-going toward leasehold improvements for a high-visibility retail space.
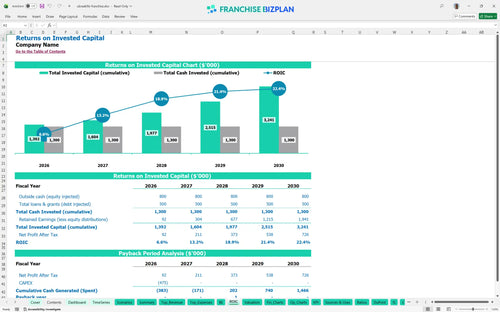
The model projects an Internal Rate of Return (IRR) of 5.31% and a Return on Equity (ROE) of 2.43 over the initial five-year period. With a 3-year payback period, the unit recovers its initial $475,000 investment relatively quickly for a retail service model, provided you hit the year-two revenue target of $1.04 million.
Monthly break-even occurs in April 2026, requiring enough volume to cover $10,250 in fixed monthly overhead plus royalties and labor. The primary driver here is walk-in repair volume; at an average ticket typical for this industry, you need consistent daily traffic to offset the $6,500 monthly rent.
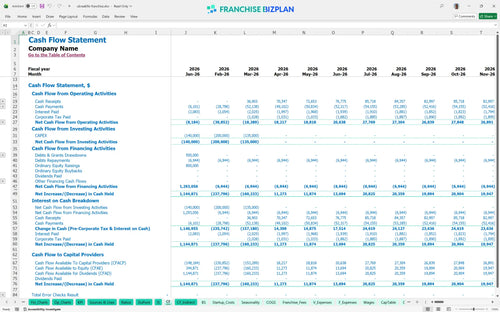
The lowest cash point occurs in March 2026 at $747,000, which includes your initial investment and early operating losses. You need to maintain a tight grip on inventory spending during the first 90 days to ensure you do not over-purchase parts for low-volume devices.
In the High scenario, where B2B contracts exceed the $250,000 year-five estimate, EBITDA margins can push past the projected 48%. Conversely, a Low scenario with 20% less walk-in traffic extends the payback period toward year four and significantly lowers the 5.31% IRR.
This franchise unit financial model lives in Excel, giving you total control over every variable from technician headcounts to parts margins. You can swap out the pre-filled repair volumes or adjust the $6,500 monthly rent to match your specific North Austin lease terms. It is built for operators who need to stress-test how a 10% drop in walk-in traffic affects the bottom line.

We have mapped out a 5-year trajectory showing revenue climbing from $805,000 in year one to over $1.96 million by year five. This repair shop business plan accounts for the ramp-up of B2B contracts, which we estimate starting at $60,000 and scaling to $250,000 as you secure local school and corporate accounts. The model tracks how EBITDA expands from $219,000 to $956,000 as your fixed costs like rent and insurance stay steady against rising volume.

Operating within a system means accounting for the 7% royalty and 2% marketing fund contribution right off the top. On a year-three revenue of $1,331,000, that is $119,790 leaving the store before you pay a single technician or utility bill. This franchise financial projection template ensures these fees are automated so you see the true net cash available for distribution or reinvestment.

Launching this electronics repair business requires a clear view of the $475,000 in hard startup costs, including $200,000 for leasehold improvements and $60,000 for initial parts inventory. Our break-even analysis shows you hitting the safety zone by April 2026, just four months after opening. Knowing your monthly fixed costs-roughly $10,250 plus labor-is vital for surviving those first 120 days.

We have baked in industry-standard labor and COGS targets to keep your projections grounded in reality. For example, parts and components should stay between 11% and 12% of revenue to maintain healthy store-level margins. If your tech payroll exceeds the benchmarks while throughput stays low, the model flags the inefficiency before it drains your cash reserves.


Simply purchase and download the financial model template, then access it instantly using Microsoft Excel or Google Sheets. No installation or technical expertise required-just open and start working.

Enter your business-specific numbers, including revenue projections, costs, and investment details. The pre-built formulas will automatically calculate financial insights, saving you time and effort.

Leverage the investor-ready format to confidently showcase your financial projections to banks, franchise representatives, or investors. Impress stakeholders with clear, data-driven insights and professional reports.

Leverage the investor-ready format to confidently present your projections to banks, franchise representatives, or investors.