
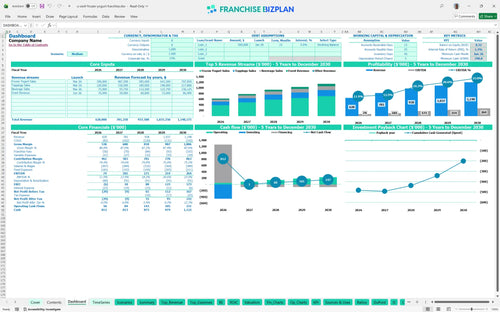
All-in-one Dashboard
Core inputs and core outputs


This franchise unit profit and loss template provides a professional-grade toolkit for forecasting revenue, managing expenses, and calculating investor returns for a retail dessert location.
Core inputs and core outputs
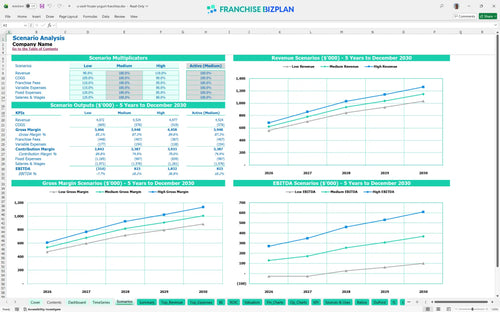
Three scenario analysis
Presentation ready
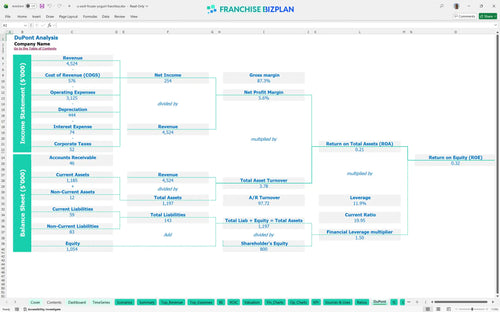
DuPont analysis
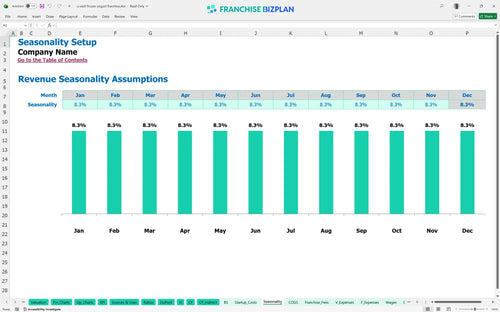
Researched revenue assumptions
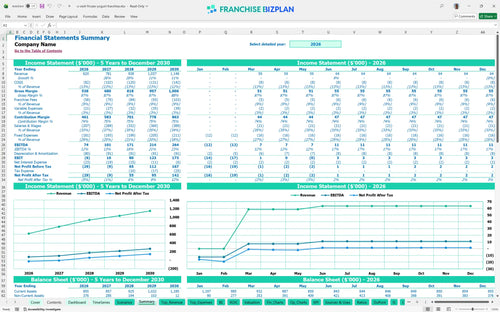
Lender-friendly financial outputs
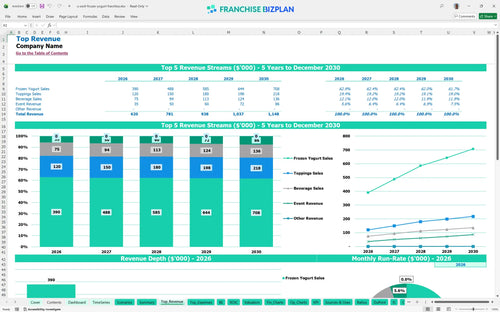
Revenue stream detailed view
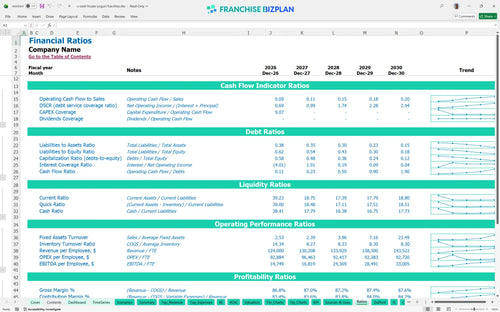
Performance metrics benchmark
We built this frozen yogurt franchise financial model using our own research into the dessert sector. Key assumptions including the 20-handle flavor rotation, $10,500 monthly rent, and the $25,000 initial fee are pre-populated and fully editable to match your specific location.
Based on the pro forma income statement for food service franchise, this unit hits its stride quickly, showing a positive EBITDA of $74,000 in the first year. By year three, as revenue climbs to $938,000, the bottom line expands significantly because fixed costs like the $10,500 monthly rent stay flat while sales grow.
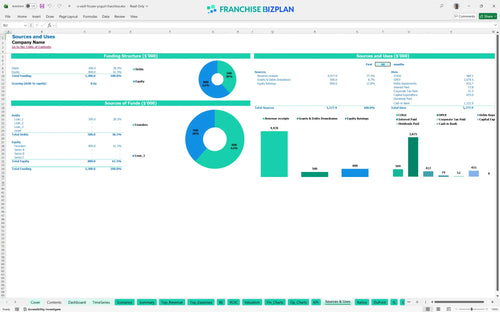
You will need a significant upfront investment, including $200,000 for leasehold improvements and $110,000 for specialized yogurt machines. The initial investment breakdown also accounts for the $25,000 franchise fee and a cash buffer to handle the ramp-up period before the April 2026 break-even date.
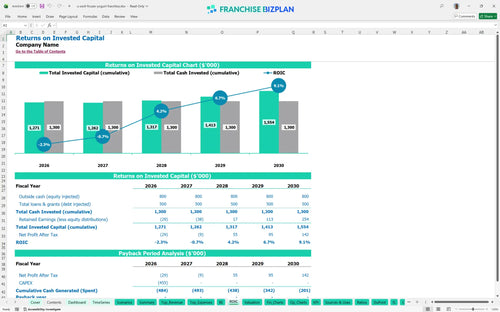
Estimating ROI for a frozen yogurt franchise location shows a steady climb, with a Return on Equity of 0.32 and an internal rate of return of 1.21%. While the payback period extends past year five, the enterprise value grows as EBITDA reaches $264,000 by the end of the fifth year.
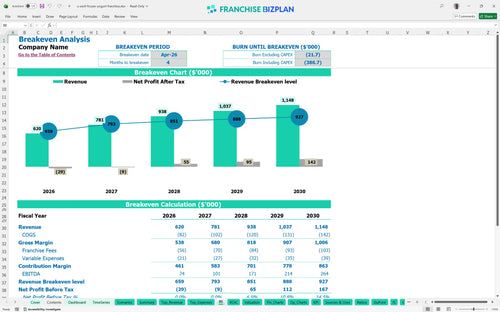
The unit reaches its monthly break-even point in April 2026, just four months after launching. To stay in the black, you need to manage the cost structure analysis for self-serve yogurt shops, specifically the 11% ingredient cost and the high-premium rent in a retail hub.
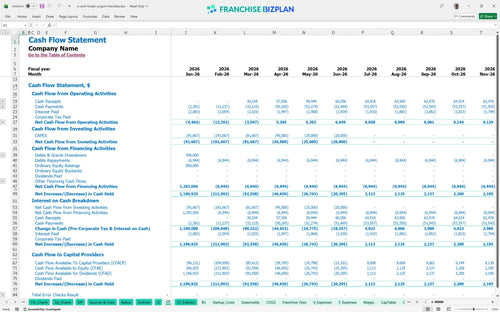
The franchise unit operating expense spreadsheet indicates the lowest cash point occurs in June 2026 at $799,000. This suggests you need a defintely solid capital cushion to cover the heavy $455,000 in total CAPEX and the initial months of operation before cash flow turns positive.
This detailed financial forecast for retail dessert business allows you to toggle between performance levels. In a high-growth scenario where revenue exceeds the $620,000 year-one target, your 6% royalty remains constant, but your store-level margin improves as you leverage fixed costs like insurance and cleaning.
This frozen yogurt franchise financial model is built in Excel, allowing you to tweak every variable from cup pricing to seasonal foot traffic. All formulas are unlocked, so you can adjust the pre-filled assumptions to match your specific territory or real estate costs without breaking the logic.

Plan your multi-unit expansion or single-store exit with a detailed financial forecast for retail dessert business that spans 60 months. It maps out the transition from the initial opening phase to a mature operation, showing exactly how scaling volume impacts your bottom line over five years.

Operating under a big brand means managing franchise royalty fees and marketing fund contributions that eat into your gross margin. This tool automates those calculations based on gross sales, ensuring you see the true net profit after the franchisor takes their 6% royalty and 3% brand fund cut.

Use the franchise startup cost calculator to total up your leasehold improvements, yogurt machines, and signage before you sign a lease. It identifies the exact monthly sales volume needed to cover your $10,500 rent and other fixed overhead, giving you a clear target for your grand opening.

Stop guessing if your 11% yogurt ingredient cost is too high; our model includes unit economics analysis based on industry standards for self-serve shops. Compare your labor spend and occupancy costs against typical dessert franchise benchmarks to ensure your store stays competitive and profitable.


Simply purchase and download the financial model template, then access it instantly using Microsoft Excel or Google Sheets. No installation or technical expertise required-just open and start working.

Enter your business-specific numbers, including revenue projections, costs, and investment details. The pre-built formulas will automatically calculate financial insights, saving you time and effort.

Leverage the investor-ready format to confidently showcase your financial projections to banks, franchise representatives, or investors. Impress stakeholders with clear, data-driven insights and professional reports.

Leverage the investor-ready format to confidently present your projections to banks, franchise representatives, or investors.