
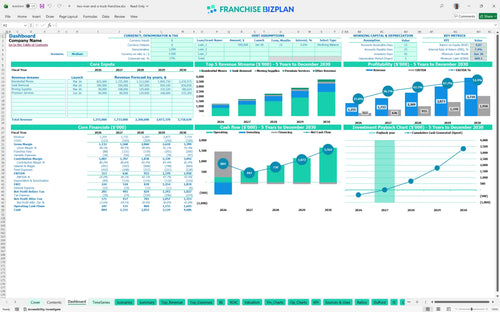
All-in-one Dashboard
Core inputs and core outputs


This Excel spreadsheet for franchise unit financial projections includes everything needed for estimating revenue for residential moving services and detailed operational expense forecasting.
Core inputs and core outputs
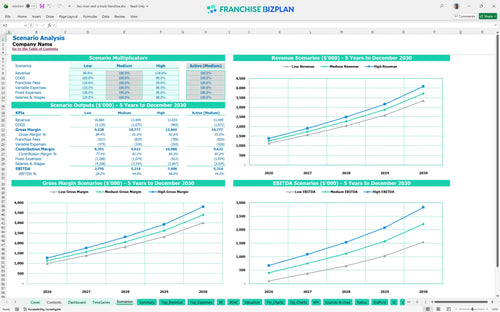
Three scenario analysis
Presentation ready

DuPont analysis
Researched revenue assumptions
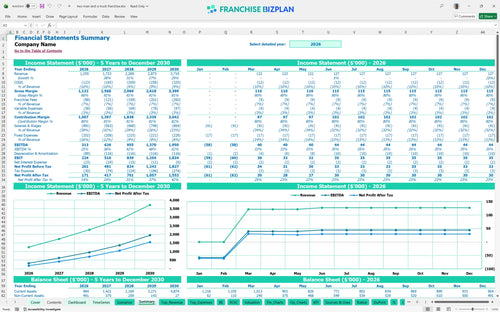
Lender-friendly financial outputs
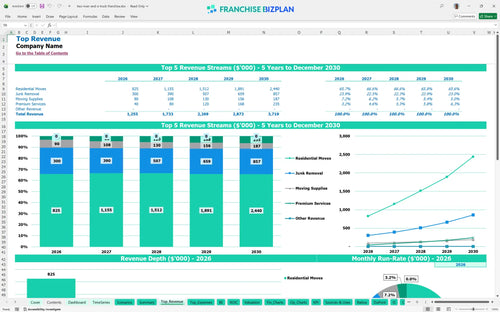
Revenue stream detailed view
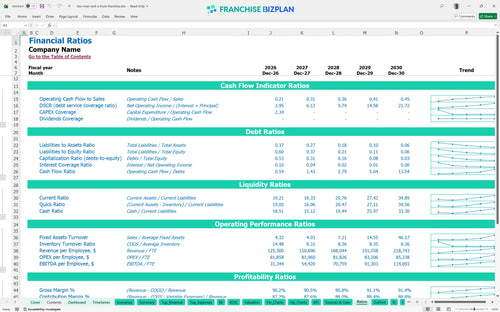
Performance metrics benchmark
We developed this model using detailed research on the relocation sector to ensure every assumption is grounded in reality. The pre-populated data covers everything from the $50,000 franchise fee to the projected $1.25M in year-one revenue, all of which you can edit to fit your specific business plan.
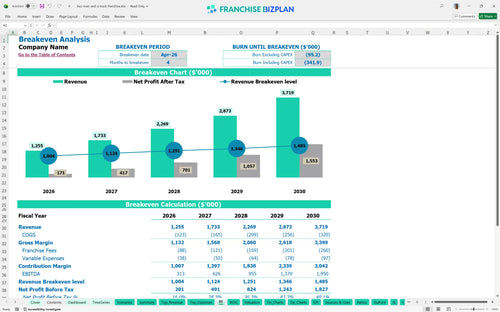
The unit is projected to reach its break-even date in April 2026, just four months after launching operations. With Year 1 EBITDA estimated at $313,000, the model shows a strong trajectory toward a $1.95M EBITDA by Year 5 as you scale residential and junk removal services.
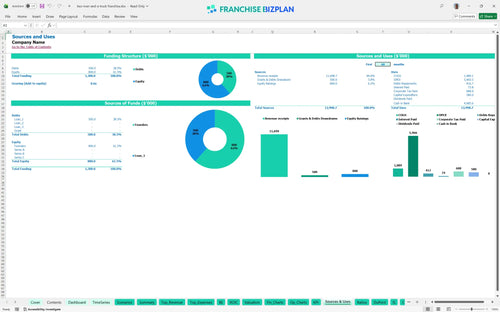
Launching this moving and junk removal business model requires a total initial investment of $580,000 in CAPEX. This franchise capital expenditure planning includes the $50,000 franchise fee, $260,000 for branded trucks, and $110,000 for leasehold improvements to your facility.
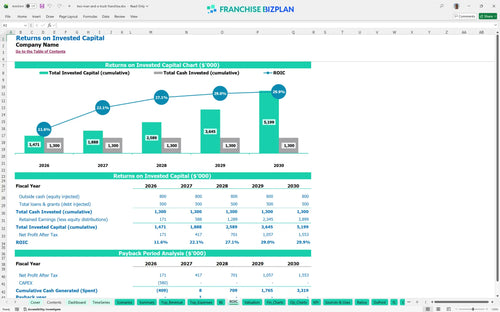
Calculating ROI for professional moving businesses using this data shows an Internal Rate of Return (IRR) of 7.37% and a Return on Equity (ROE) of 4.87%. The most compelling metric for owners is the 2-year payback period, which is relatively fast for a business with such high equipment costs.
Monthly break-even is achieved when revenue covers the $10,000 rent and $15,000+ in management salaries. Managing labor costs in moving franchise operations is the primary lever for reaching this point faster, as mover wages scale directly with your job volume.
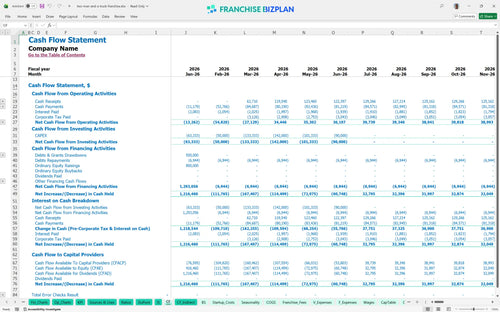
Your small business cash flow projection identifies the lowest cash point as $689,000 in June 2026. This indicates you need a significant cash buffer during the first six months to handle the timing gap between truck acquisition and peak summer moving revenue.
Switching between scenarios shows that a high-performance case can defintely pull the payback period under 18 months if premium service revenue exceeds targets. Conversely, the low case highlights the risk of the $10,000 fixed rent if residential move volume stays below $500,000 in Year 1.
This moving company franchise financial model is built in Excel with fully editable assumptions and pre-filled formulas. You can easily adapt the model to your specific territory by adjusting revenue drivers, local labor rates, and facility rent to see how different operating scenarios impact your bottom line.

Plan for long-term growth with a professional moving business financial plan that maps out five years of performance. The model tracks the transition from a single-truck startup to a mature multi-unit operation, providing detailed views of annual revenue, cash flow, and long-term profitability targets.

This tool simplifies the franchise royalty fee calculation by automatically applying the 6% royalty and 1% marketing fund contributions against your gross sales. It captures the real economics of the franchise system, ensuring you account for every dollar owed to the franchisor before calculating your net take-home pay.

Use this franchise startup cost spreadsheet to determine how to calculate moving franchise startup costs for your specific market. It provides a clear moving company franchise investment breakdown, helping you identify the exact sales volume required to cover your $10,000 monthly rent and variable operational costs.

This franchise unit profitability template incorporates researched moving industry profit margins to help you sanity-check your projections. By comparing your estimated fuel costs and mover wages against industry standards, you can ensure your financial model remains realistic and achievable in a competitive market.


Simply purchase and download the financial model template, then access it instantly using Microsoft Excel or Google Sheets. No installation or technical expertise required-just open and start working.

Enter your business-specific numbers, including revenue projections, costs, and investment details. The pre-built formulas will automatically calculate financial insights, saving you time and effort.

Leverage the investor-ready format to confidently showcase your financial projections to banks, franchise representatives, or investors. Impress stakeholders with clear, data-driven insights and professional reports.

Leverage the investor-ready format to confidently present your projections to banks, franchise representatives, or investors.