
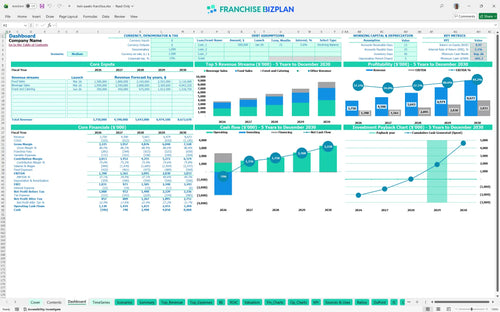
All-in-one Dashboard
Core inputs and core outputs


This franchise unit financial model template provides a comprehensive toolkit for analyzing the store-level margins and long-term viability of a sports-themed restaurant.
Core inputs and core outputs
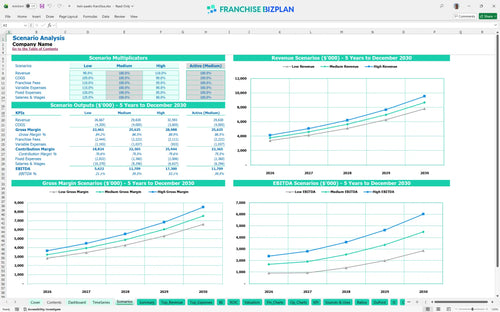
Three scenario analysis
Presentation ready
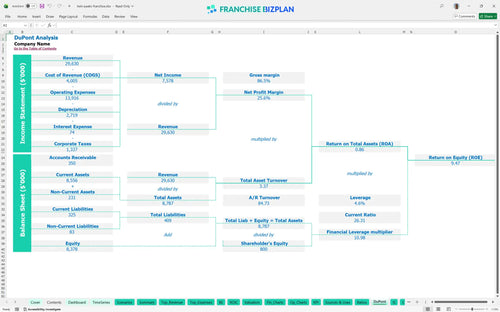
DuPont analysis
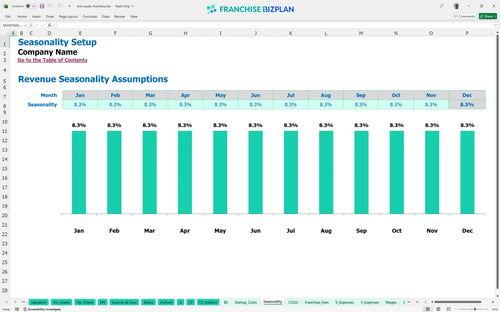
Researched revenue assumptions
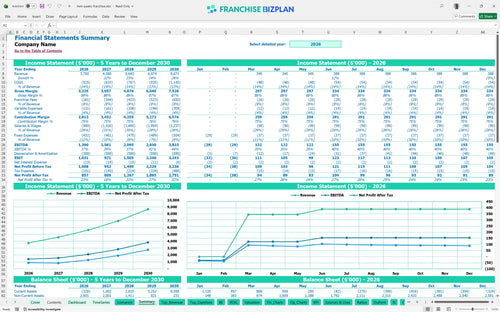
Lender-friendly financial outputs
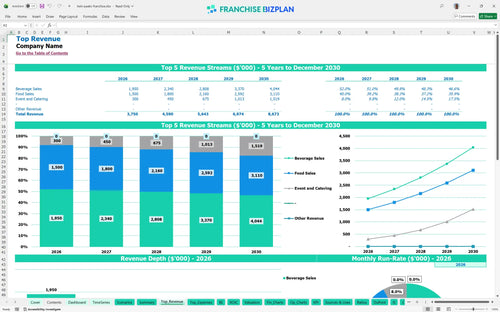
Revenue stream detailed view
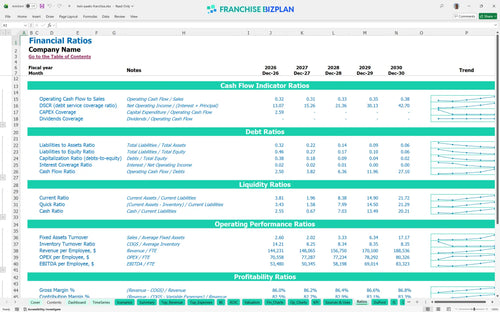
Performance metrics benchmark
We built this model using our own research to ensure your EBITDA franchise calculation is as accurate as possible. Key assumptions like the $3.75M first-year revenue and the $50,000 initial fee are pre-populated with researched data specific to this sports lodge unit and are fully editable. This tool helps you track everything from the $2.95M total build-out to the 5% royalty and 2.5% marketing fund contributions.
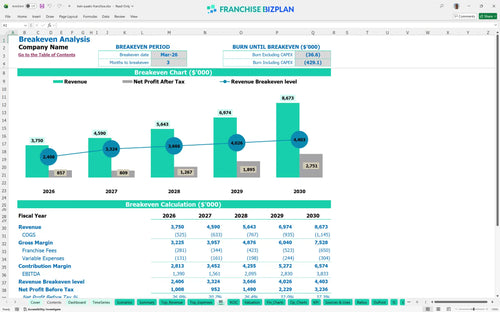
This sports lodge unit hits its stride quickly, reaching the monthly break-even point by March 2026. Based on the $3.75M year-one revenue and 5% royalty, your franchise profitability analysis shows the unit becomes fully profitable within its first year of operation. Speed to profit is the only metric that pays the bills.
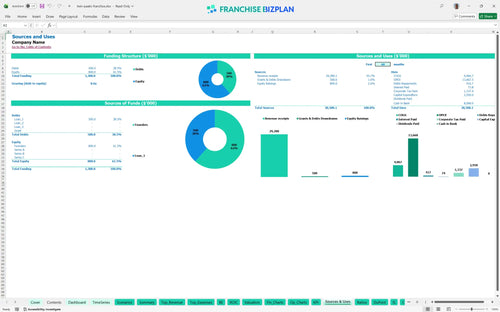
Launching this unit in the US requires a total initial investment of $2,950,000 to cover everything from the franchise fee to the build-out. Most of your sports bar franchise startup costs are tied up in leasehold improvements and specialized equipment to meet brand standards. Capital is fuel; don't run out before the race starts.
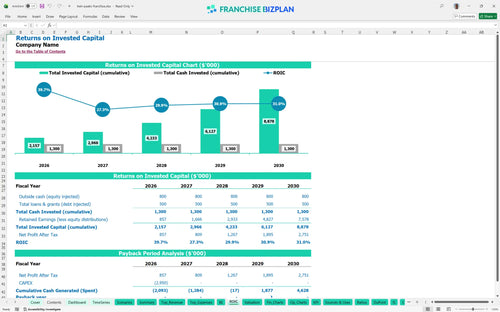
Investors can expect an Internal Rate of Return of 5.14% and a Return on Equity of 9.47% over the initial five-year term. The franchise investment ROI shows a payback period of 4 years, which is standard for a high-CAPEX restaurant build. Returns are the reward for calculated risk.
You need to hit the break-even point within 3 months to stay on track with the $3.75M annual revenue target. Analyzing break-even point for new franchise locations shows the biggest driver is managing the $25,000 monthly rent against high-volume beverage sales. Break-even is your first real victory.
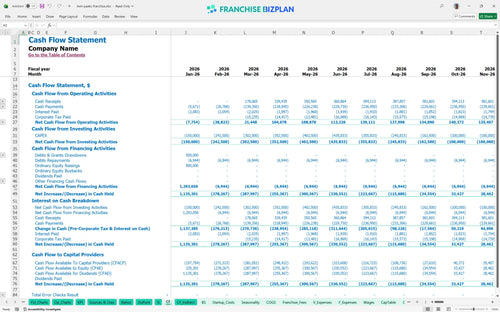
The lowest cash point hits -$691,000 in September 2026, meaning you defintely need a solid working capital buffer during the first six months. This franchise investment analysis spreadsheet helps you visualize the gap between the $2.95M build-out and the ramp-up of event-driven revenue. Cash is king, but runway is its kingdom.
Moving to a high-revenue scenario significantly shortens the 4-year payback and boosts the year-5 EBITDA of $3.83M. Your revenue projection model for sports-themed restaurants should focus on estimating food and labor costs for franchise operations during peak NFL and UFC events. Plan for the best, but prepare for the rest.
This franchise financial model template is a fully editable Excel tool that lets you swap out assumptions as fast as a lunch rush. You can adjust every formula, from revenue drivers to local tax rates, making it easy to see how a different zip code or a higher average ticket changes your bottom line. Use this Excel template for franchise financial forecasting to build a scenario that actually fits your specific market. Control your numbers, control your future.

Building a serious restaurant franchise business plan requires looking past the grand opening to the next five years of growth. This model provides a detailed restaurant franchise profit and loss statement example that tracks your progress from the first month of trading through year five. It maps out your path to maturity, so you can see when cash flow finally stabilizes. Five years of foresight fits on one screen.

Success in this concept depends on managing the 5% royalty and 2.5% brand fund contributions without choking your store-level margin. Our franchise unit financial projections bake these costs directly into your monthly cash flow, so there are no surprises when the franchisor bill arrives. Following best practices for franchise unit financial planning means accounting for every penny of brand overhead from day one. Royalties are a reality; plan for them.

Knowing how to calculate startup costs for a restaurant franchise is the difference between a smooth launch and a mid-construction crisis. This model tracks every major capital expenditure, including the $1.2M leasehold improvement and $400,000 in kitchen equipment, to give you a clear total investment figure. It calculates exactly what sales volume you need to stop burning cash and start making it. Know your floor before you build the ceiling.

We've loaded this model with key performance indicators for sports bar franchises to help you spot if your operating expenses are out of whack. If your labor costs or rent-to-sales ratios drift too far from industry norms, the model flags it so you can adjust your staffing or site selection. It's a reality check for your pro forma that keeps your expectations grounded in real-world data. Don't guess when you can benchmark.


Simply purchase and download the financial model template, then access it instantly using Microsoft Excel or Google Sheets. No installation or technical expertise required-just open and start working.

Enter your business-specific numbers, including revenue projections, costs, and investment details. The pre-built formulas will automatically calculate financial insights, saving you time and effort.

Leverage the investor-ready format to confidently showcase your financial projections to banks, franchise representatives, or investors. Impress stakeholders with clear, data-driven insights and professional reports.

Leverage the investor-ready format to confidently present your projections to banks, franchise representatives, or investors.