
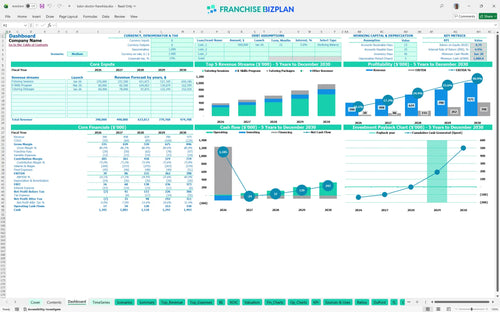
All-in-one Dashboard
Core inputs and core outputs


This comprehensive franchise financial model template provides everything an operator needs to forecast revenue, manage expenses, and track long-term ROI for a tutoring unit.
Core inputs and core outputs
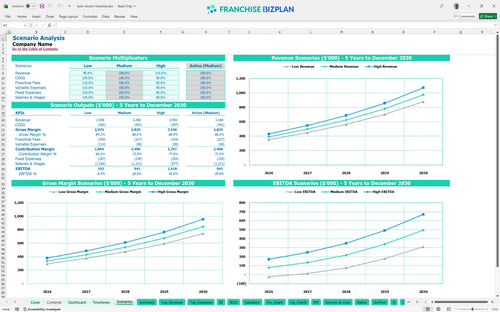
Three scenario analysis
Presentation ready
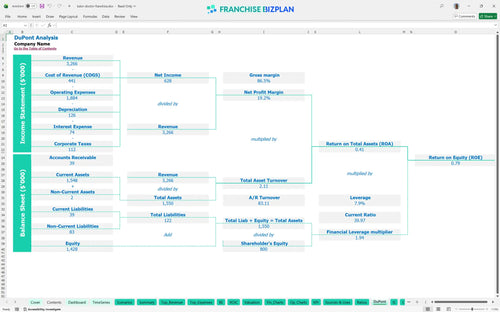
DuPont analysis
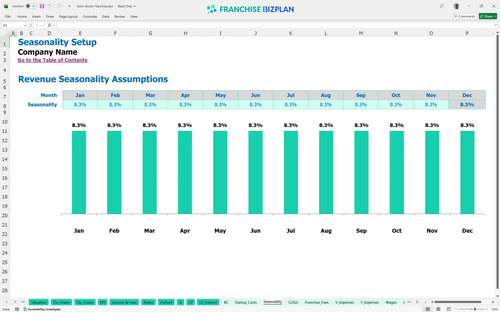
Researched revenue assumptions
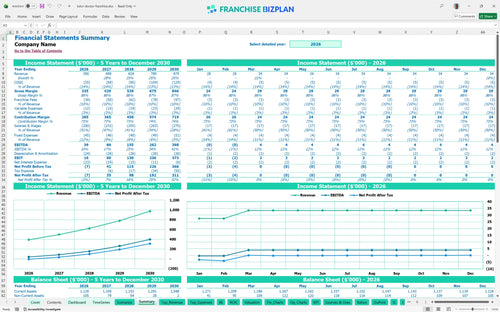
Lender-friendly financial outputs
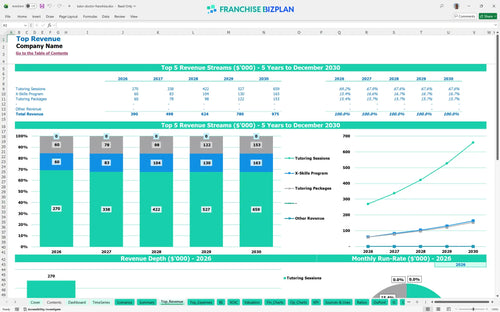
Revenue stream detailed view
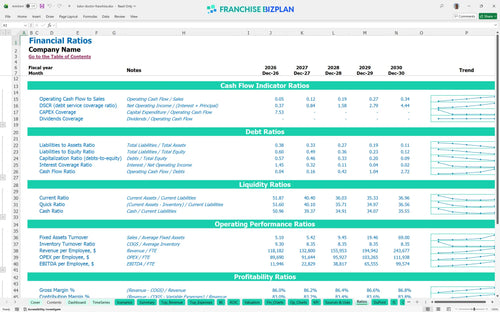
Performance metrics benchmark
We developed this financial model for in-home tutoring business operations based on extensive market research. The pre-populated data includes year 1 revenue of $390,000 and a 10% combined royalty and marketing fee, all of which you can edit to fit your specific market. It is a practical tool for predicting revenue for education franchise units while keeping a close eye on the bottom line.
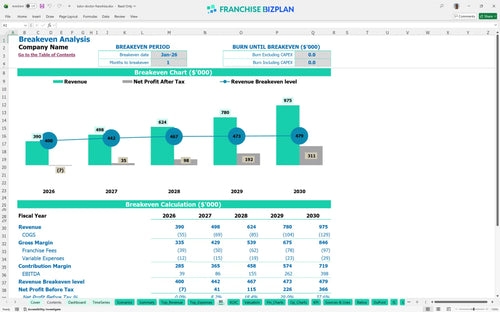
Based on the data, this unit hits its break-even date in January 2026, essentially the first month of operation. While initial EBITDA starts at $39,000 in year one, it scales significantly to $398,000 by year five as you optimize tutor payments and scale the student base.
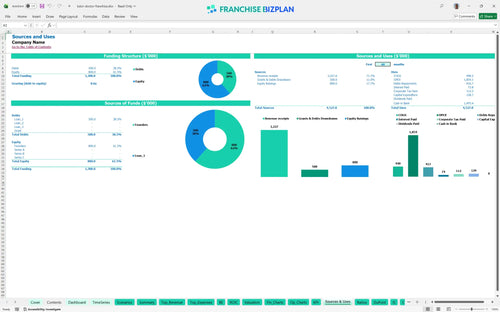
To figure out how to calculate startup costs for a tutoring franchise, we look at the total initial outlay. You will need roughly $128,700 for the core setup, which covers the $54,700 franchise fee, office fit-out, and initial launch marketing to build your student pipeline.
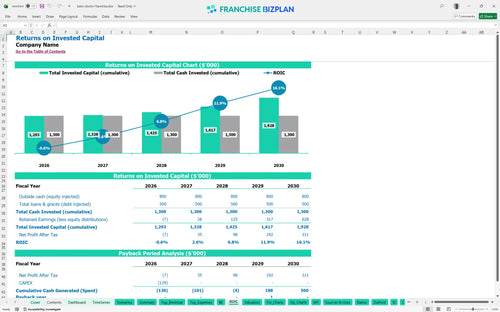
The franchise investment ROI shows an Internal Rate of Return (IRR) of 4.88% and a Return on Equity (ROE) of 0.79. This franchise investment analysis spreadsheet estimates a 4-year payback period, which is standard for a service-based business with high initial intangible costs.
The model indicates a break-even point in the first month, but this assumes you hit the ground running with $180,000 in tutoring sessions annually. Estimating recurring revenue for educational services is the biggest lever here, especially when managing your fixed monthly costs of $3,750.
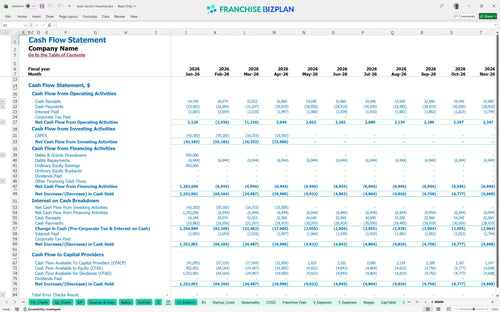
The lowest cash point occurs in January 2028 at $1,081,000, suggesting the model accounts for significant expansion reserves. Still, planning operational costs for tutoring centers requires monitoring the timing between paying tutors and collecting student fees to avoid short-term crunches.
Using an Excel template for franchise financial forecasting allows you to test how a 10% drop in revenue affects your 4-year payback. In high-growth scenarios, scaling the X-Skills program faster than the base tutoring sessions can defintely drive margins toward that $398,000 year-five target.
Finance: update unit break-even and payback model by Friday
This franchise unit financial model is fully customizable in Excel, featuring pre-filled formulas and editable assumptions. You can easily adjust the inputs to match your specific territory, local labor rates, and territory-specific demand using best practices for tutoring business financial planning to manage franchise operating expenses effectively.

Long-term planning is vital for any educational franchise financial projections. This tool provides detailed 5-year views of revenue, costs, and cash flow, helping you map out a franchise profitability analysis that takes you from a single-unit startup to a mature, high-volume operation with $975,000 in annual sales.

Managing royalty and marketing fees in franchise model setups is often where new owners trip up. This template handles your royalty fee calculation by automatically applying the 8% royalty and 2% marketing fund contributions, ensuring your net margin reflects the actual cost of brand support and proprietary algorithm access.

Use this franchise business plan Excel tool to master your break-even analysis. It aggregates the $54,700 franchise fee with fit-out and launch costs to show exactly how much volume you need to cover your fixed monthly overhead of $3,750, including rent and professional fees.

The model includes built-in benchmarks to help you evaluate franchise unit economic performance metrics against industry standards. This ensures your labor costs, like the $65,000 operations manager salary, and unit economics stay within a realistic range for a premium, white-glove tutoring business.


Simply purchase and download the financial model template, then access it instantly using Microsoft Excel or Google Sheets. No installation or technical expertise required-just open and start working.

Enter your business-specific numbers, including revenue projections, costs, and investment details. The pre-built formulas will automatically calculate financial insights, saving you time and effort.

Leverage the investor-ready format to confidently showcase your financial projections to banks, franchise representatives, or investors. Impress stakeholders with clear, data-driven insights and professional reports.

Leverage the investor-ready format to confidently present your projections to banks, franchise representatives, or investors.