
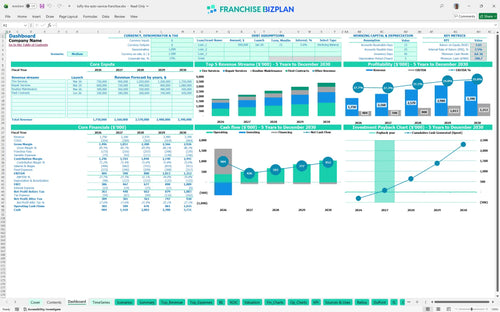
All-in-one Dashboard
Core inputs and core outputs


This Excel financial model for automotive service center operations provides a complete toolkit including 5-year projections, CAPEX scheduling, and detailed break-even analysis for a new franchise location.
Core inputs and core outputs
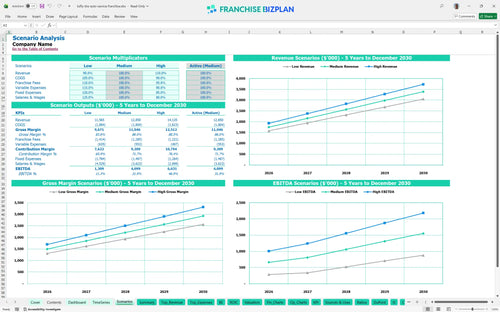
Three scenario analysis
Presentation ready
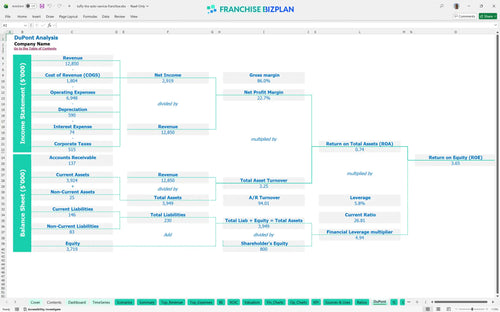
DuPont analysis
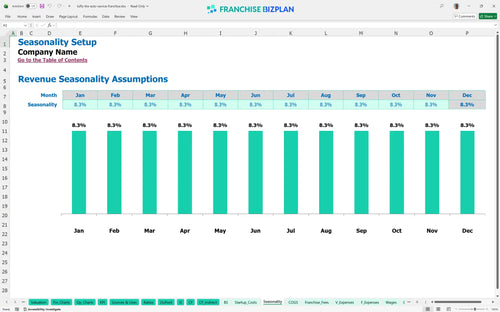
Researched revenue assumptions
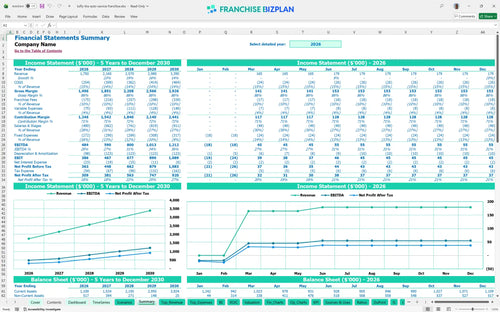
Lender-friendly financial outputs
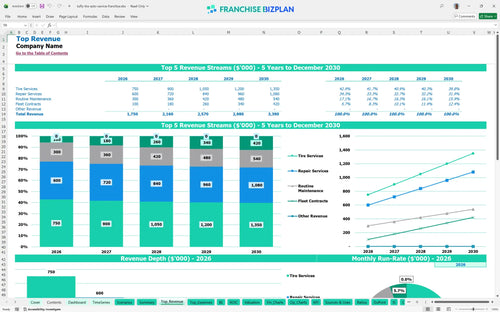
Revenue stream detailed view
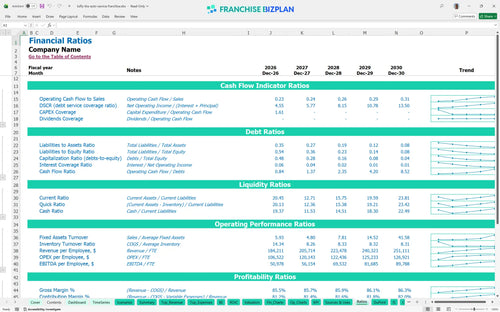
Performance metrics benchmark
We built this franchise unit financial model using intensive research on the tire and auto repair sector. Key assumptions for this franchise unit, including the $1.75 million year-one revenue and the 10% total fee structure, are pre-populated with researched data and are fully editable to match your specific territory. This model provides a clear franchise unit financial projection to guide your investment decision.
Profitability starts in March 2026, just three months after opening. By year five, the model projects an EBITDA of $1.212 million, assuming you successfully transition from basic tire services to high-margin repair work and fleet contracts. Speed to profit depends on technician efficiency.
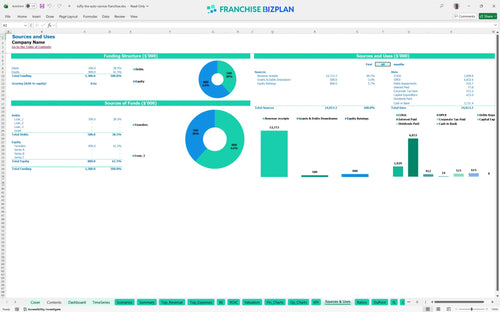
To launch this unit, you need to plan for a significant capital expenditure. The financial planning for auto repair business startup includes a $30,000 franchise fee and major outlays like $250,000 for build-out and $120,000 for shop equipment to ensure you aren't undercapitalized at the start.
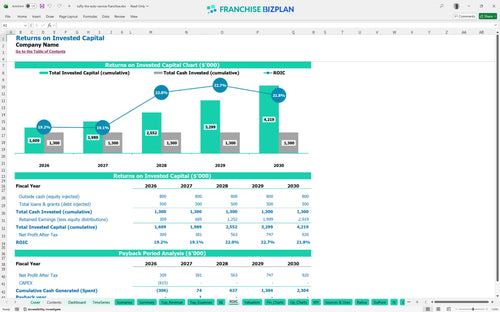
Analyzing franchise profitability and ROI is simple with a 2-year payback period and an IRR of 7.49%. While the ROE sits at 3.65%, the steady climb in annual revenue to $3.39 million by year five provides a strong foundation for any return on investment calculation.
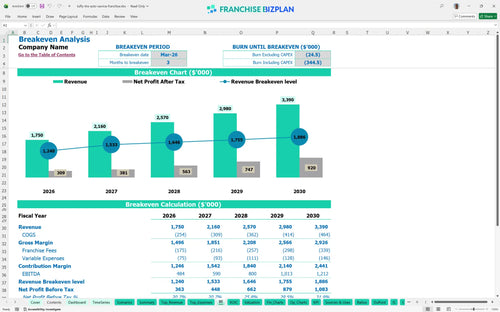
You reach the break-even point 3 months after the March 2026 launch. The primary driver here is the high-margin repair service volume, which must offset the $15,000 monthly rent and the $22,600 in combined monthly insurance, utility, and maintenance costs. High throughput is your best friend.
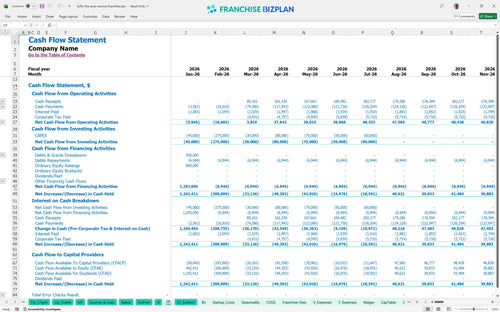
Your minimum cash position hits $781,000 in July 2026. This indicates a healthy buffer, but you still need to watch the timing of your $60,000 concierge vehicle purchase to ensure liquidity stays high in this monthly cash flow template for franchise owners. Cash is the oxygen of your shop.
This financial feasibility study for franchise unit success compares how you should how to forecast automotive service revenue under different market pressures. In the high case, aggressive fleet contract acquisition pushes year-1 revenue past the $1.75 million baseline, significantly improving your operating budget template for auto repair shop performance.
Finance: update unit break-even and payback model by Friday.
This franchise financial model template is built in Excel, allowing you to swap out every assumption from tire service volume to shop supply costs. It uses pre-filled formulas so you can test how a 2% shift in parts margins or a change in tech labor rates impacts your bottom line. Control your numbers before they control you.

Planning for an auto repair shop business plan requires looking beyond the first year of oil changes. This model scales your revenue forecasting from $1.75 million in year one to $3.39 million by year five, accounting for the ramp-up in fleet contracts and organic local growth. Five years of data beats five months of guessing.

Operating a franchise means managing a 5% royalty and a 5% marketing fund off the top. This model calculates these operating expenses automatically against your revenue projections for tire and auto shop services, ensuring you see the true net cash available after the brand takes its cut. Royalties are a fixed reality, not a variable suggestion.

Using a franchise startup costs calculator is the first step to avoiding a cash crunch. With $250,000 earmarked for leasehold improvements and $120,000 for lifts, this tool provides a clear break-even analysis to show exactly when your monthly ticket volume covers the $15,000 prime location rent. Knowing your break-even is the difference between a business and a hobby.

We've integrated automotive franchise profitability analysis benchmarks so you can compare your $85,000 GM salary or 12% parts cost against industry norms. This helps you defintely identify if your estimating labor costs for auto repair business operations are bloated or if your shop supplies are running too high. Benchmarks keep your ego in check and your margins in line.


Simply purchase and download the financial model template, then access it instantly using Microsoft Excel or Google Sheets. No installation or technical expertise required-just open and start working.

Enter your business-specific numbers, including revenue projections, costs, and investment details. The pre-built formulas will automatically calculate financial insights, saving you time and effort.

Leverage the investor-ready format to confidently showcase your financial projections to banks, franchise representatives, or investors. Impress stakeholders with clear, data-driven insights and professional reports.

Leverage the investor-ready format to confidently present your projections to banks, franchise representatives, or investors.