
All-in-one Dashboard
Core inputs and core outputs


This franchise unit financial projection provides a complete roadmap for estimating cash flow, profitability, and the total capital required to open and scale a repair shop.
Core inputs and core outputs
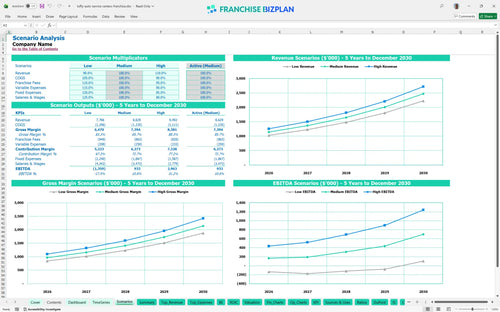
Three scenario analysis
Presentation ready
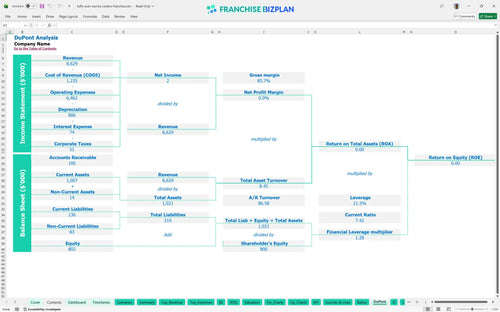
DuPont analysis
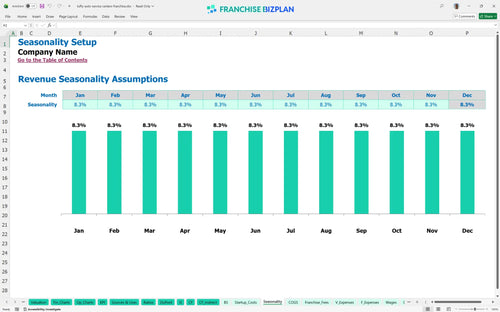
Researched revenue assumptions
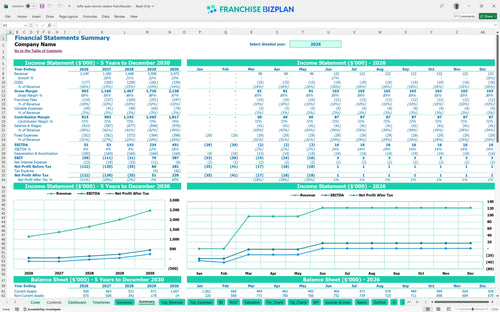
Lender-friendly financial outputs
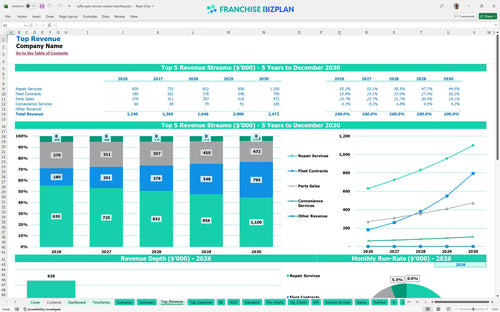
Revenue stream detailed view
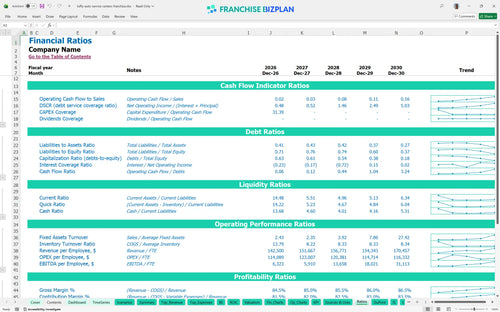
Performance metrics benchmark
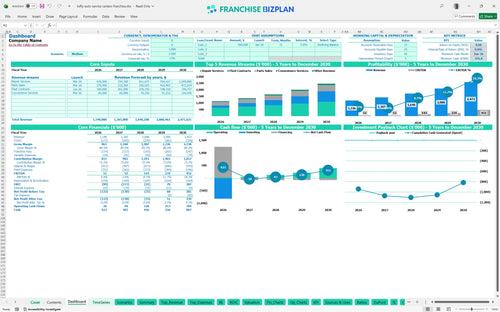
We built this franchise unit financial model using our own research to reflect the actual costs of running a high-volume service center. Key assumptions like calculating fleet maintenance contract margins and technician wages are pre-populated with researched data but are fully editable, showing a Year 1 EBITDA of $51,000 and a steady climb as you build customer trust.
You can expect to see positive EBITDA in Year 1, but true bottom-line strength arrives in Year 3 when earnings hit $143,000 after all fixed and variable costs. Here is the quick math: as revenue doubles by Year 4, fixed costs like the $20,000 rent stay flat, allowing margins to expand significantly in your profit and loss statement.
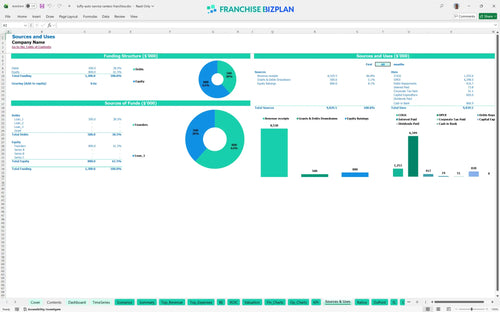
Launching this unit in the US requires significant upfront capital, primarily driven by $280,000 in leasehold improvements and $160,000 in diagnostic equipment. Total initial investment exceeds $800,000, so you will need to use this startup budget template for auto repair shop to manage your $30,000 franchise fee and opening cash buffer.
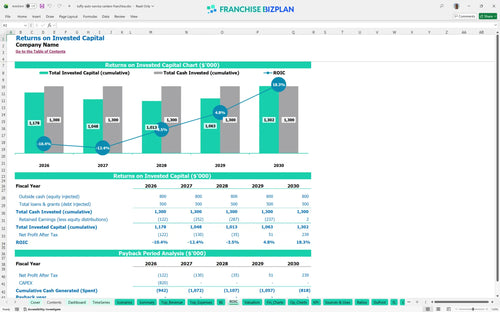
The return on investment analysis shows a payback period extending beyond year 5, which is common for high-CAPEX automotive plays when evaluating franchise financial disclosure document data. While the 5-year IRR is slightly negative at -0.05%, the Year 5 EBITDA of $451,000 suggests the real value is in the long-term equity and cash flow of a mature shop.
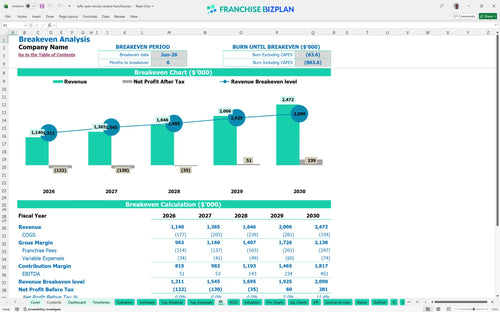
You will hit the monthly break-even point in June 2026, roughly 6 months after starting your operations. The main driver here is technician throughput; if your $48,000-salary techs are not billing enough hours to cover the $20,000 monthly rent and 10% royalty burden, that date will slip defintely.
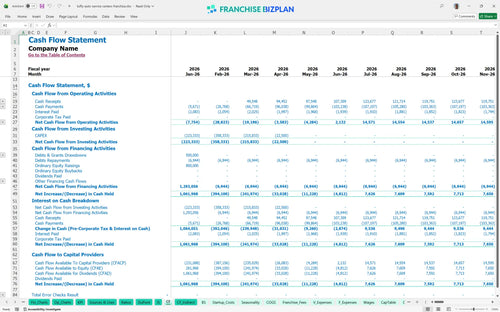
Your lowest cash point is projected for June 2026 at $377,000, which includes your operating buffer and initial parts inventory. Honestly, if leasehold improvements run over budget or if the $35,000 initial parts inventory does not turn fast enough, you will want an extra 15% in working capital just in case.
Moving from a Medium to a High scenario usually involves a 10-15% bump in fleet contract volume, which drastically changes Year 1 margins in this Excel spreadsheet for franchise financial forecasting. A Low scenario where revenue drags by 20% would likely push your break-even date into Year 2 and require more than the $377,000 minimum cash buffer.
Finance: update unit break-even and payback model by Friday.
This auto repair franchise financial model is built in Excel so you can tweak every variable from bay count to labor rates. We have pre-loaded it with researched data, but you can easily adjust the inputs to match your specific territory or real estate costs using this automotive franchise investment calculator.

Planning for a five-year horizon is critical when your Year 1 revenue is projected to hit $1,140,000 compared to $2,472,000 in Year 5. The model tracks this trajectory, showing how EBITDA scales from $51,000 to $451,000 as your shop gains local authority and expands its automotive service franchise revenue projections.

The model accounts for the 5% royalty and 5% marketing fee, totaling 10% of gross sales off the top, which is a vital part of any franchise fee breakdown. At Year 3 revenue of $1,646,000, that is $164,600 going to the brand fund and franchisor before you pay a single technician or cover other operating expenses.

You need to know exactly when the bleeding stops, and this auto service center startup costs tool shows a 6-month path to break-even. With over $800,000 in initial CAPEX including $280,000 for leasehold improvements, managing your ramp-up speed is the difference between success and a cash crunch in your franchise business plan template.

We have baked in benchmarks for parts margins and labor efficiency so you can see if your 13.5% parts COGS is realistic for an auto repair shop franchise profitability analysis. Comparing your projected $20,000 monthly rent against industry standards helps ensure your site selection does not sink the unit economics before you even open.


Simply purchase and download the financial model template, then access it instantly using Microsoft Excel or Google Sheets. No installation or technical expertise required-just open and start working.

Enter your business-specific numbers, including revenue projections, costs, and investment details. The pre-built formulas will automatically calculate financial insights, saving you time and effort.

Leverage the investor-ready format to confidently showcase your financial projections to banks, franchise representatives, or investors. Impress stakeholders with clear, data-driven insights and professional reports.

Leverage the investor-ready format to confidently present your projections to banks, franchise representatives, or investors.