
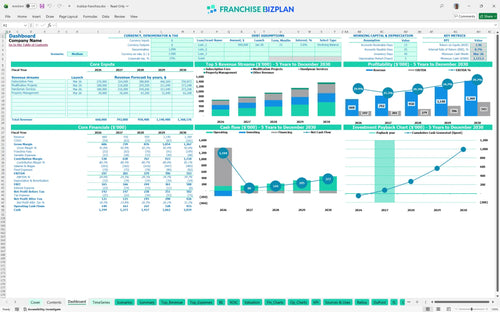
All-in-one Dashboard
Core inputs and core outputs


This small business franchise financial forecasting excel provides a complete roadmap for forecasting revenue, expenses, and cash flow for a new home maintenance territory. This is the engine room of your business planning.
Core inputs and core outputs
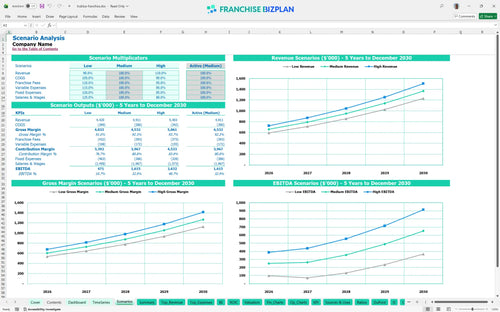
Three scenario analysis
Presentation ready
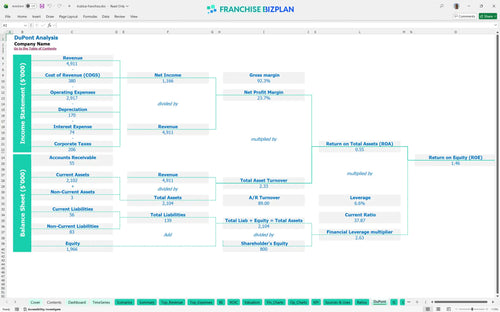
DuPont analysis
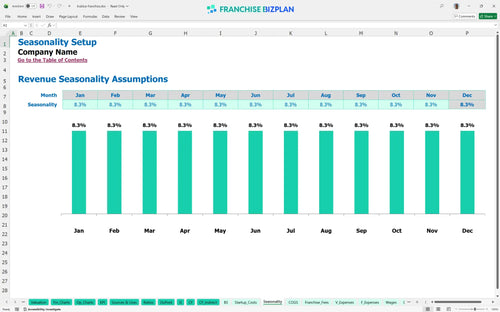
Researched revenue assumptions
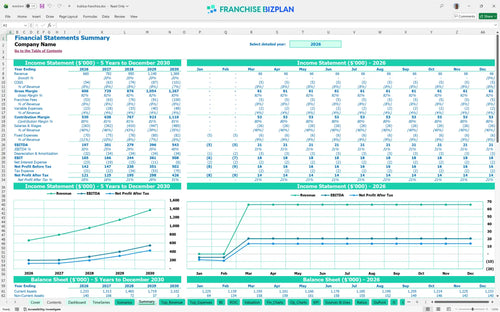
Lender-friendly financial outputs
Revenue stream detailed view
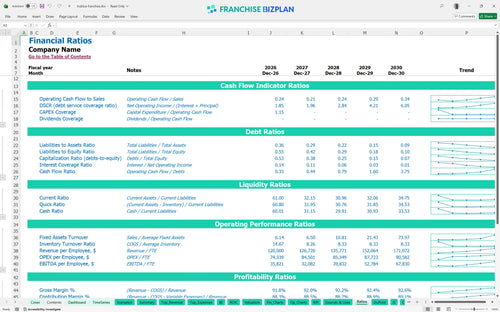
Performance metrics benchmark
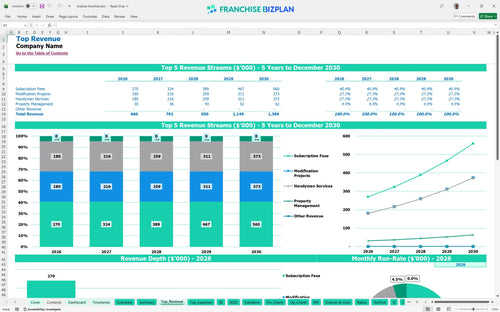
We built this financial model template for senior home modification business using deep research into the home service sector. Pre-populated data covers four main revenue streams-subscriptions, modifications, handyman tasks, and property management-and is defintely ready for you to tweak. With Year 1 revenue projected at $660,000 and an EBITDA of $197,000, the model provides a data-driven starting point for your financial planning for aging in place service business. Data-driven decisions beat gut feelings every time.
This unit starts generating a positive EBITDA of $197,000 in its first year, with net profit climbing steadily as you scale. By Year 5, you are looking at an EBITDA of $543,000 after accounting for all royalties and evaluating profitability of home maintenance franchise opportunities. Profit isn't an accident; it's the result of tight labor management.
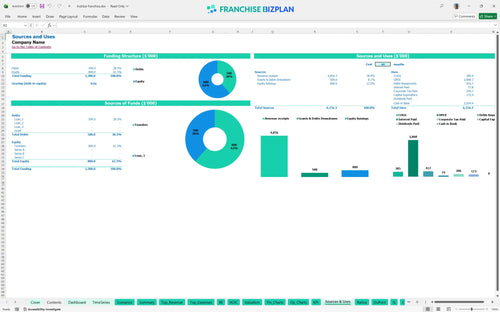
You need approximately $172,400 in home service franchise startup costs to launch this unit in the US. This total includes the $49,900 franchise fee, $65,000 for service vehicles, and $18,000 for specialized tools and equipment. Capital is fuel, and you don't want to run out halfway through the ramp-up.
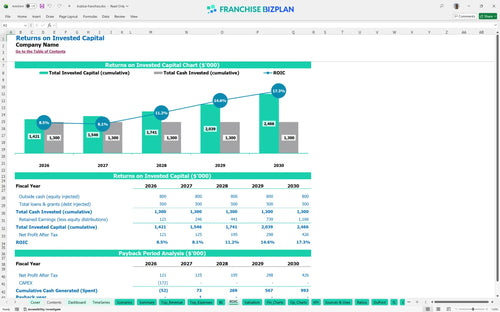
Based on the projections in this franchise ROI calculator, you can expect an IRR of 8.69% and a Return on Equity of 1.46. The franchise investment return analysis spreadsheet shows a payback period of 2 years, which is strong for a service-based model. Time is your most expensive asset, so watch that payback period.
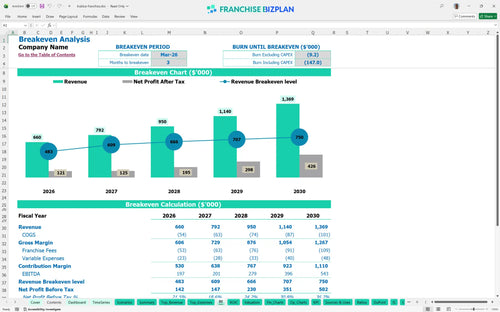
You hit break-even in March 2026, just 3 months after you start. The biggest factor when you build a financial projection for a new franchise is your labor cost, specifically managing the $211,000 initial annual salary load. Speed to break-even is the best indicator of long-term survival.
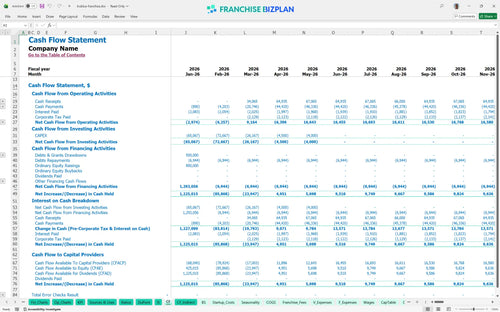
Your lowest cash point occurs in March 2026 at $1,115,000, which includes your initial funding buffer. You must monitor your franchise unit cash flow analysis for service businesses closely while estimating monthly operating expenses for new franchise units. Cash is oxygen, and the first six months are a high-altitude climb.
Shifting to a low case for home maintenance franchise operations can push your payback period past the 2-year mark. Still, hitting a high case by maximizing your modification ticket size can significantly boost your Year 1 margin above the projected 29.8% EBITDA. Hope is not a strategy, but a high case scenario is a great target.
This franchise financial model template is a flexible Excel tool designed to handle the messy reality of home service operations. You can swap out every assumption, from tech spend to local rent, without breaking the pre-filled formulas. It is built so you can model a specific territory and see the impact on your franchise unit profitability analysis instantly. Every 1-point margin leak matters fast in a single-unit model.

Planning for the long haul requires more than a gut feeling, so we built senior home care franchise financial projections into this tool. You will see revenue scale from $660,000 in Year 1 to $1,369,000 by Year 5, giving you a clear view of how EBITDA grows as the territory matures. It maps out your cash flow and balance sheet to help you prepare for multi-unit expansion. Long-term value is built on compounding renewals, not just the first sale.

Managing a recurring revenue franchise model means staying on top of your 6% royalty and 2% marketing fund obligations every single month. This model automatically calculates these fees based on your projected sales, including the initial $49,900 franchise fee. It ensures you understand exactly how much cash stays in your pocket after the franchisor takes their cut. Royalties are a top-line tax, so you better get top-line value from the brand.

Knowing how to calculate startup costs for a home service franchise is the difference between a smooth launch and a cash crunch. This tool breaks down your $172,400 initial investment and identifies your break-even point, which hits in March 2026. You will see the exact sales volume needed to cover your $3,500 monthly rent and $211,000 in annual base management salaries. Break-even depends more on local density than headline sales.

We incorporated built-in benchmarks for the aging in place business model to help with your franchise investment assessment. If your material costs for home modification projects drift above 7%, the model flags it compared to standard performance. It is a reality check that compares your labor and occupancy costs against high-performing service units. Benchmarks keep your ego in check and your bank account in the black.


Simply purchase and download the financial model template, then access it instantly using Microsoft Excel or Google Sheets. No installation or technical expertise required-just open and start working.

Enter your business-specific numbers, including revenue projections, costs, and investment details. The pre-built formulas will automatically calculate financial insights, saving you time and effort.

Leverage the investor-ready format to confidently showcase your financial projections to banks, franchise representatives, or investors. Impress stakeholders with clear, data-driven insights and professional reports.

Leverage the investor-ready format to confidently present your projections to banks, franchise representatives, or investors.