
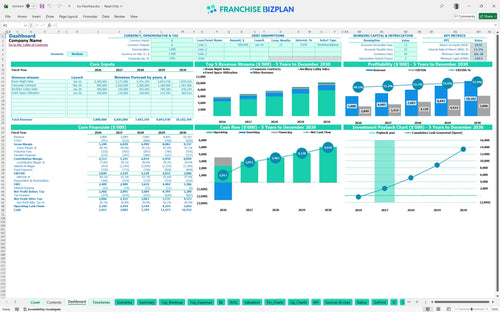
All-in-one Dashboard
Core inputs and core outputs


This franchise unit business plan template delivers a robust, 5-year Excel framework for analyzing startup costs, operational margins, and long-term ROI for a new hotel location.
Core inputs and core outputs
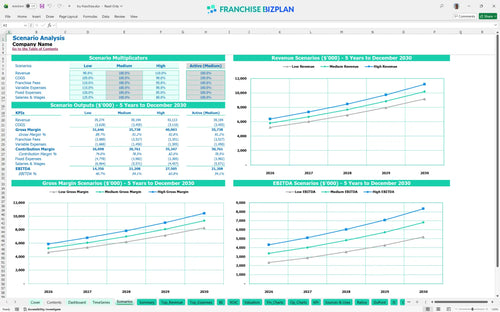
Three scenario analysis
Presentation ready
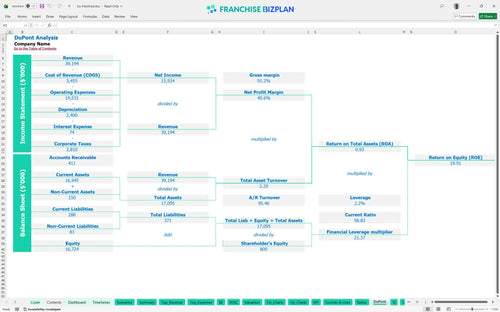
DuPont analysis
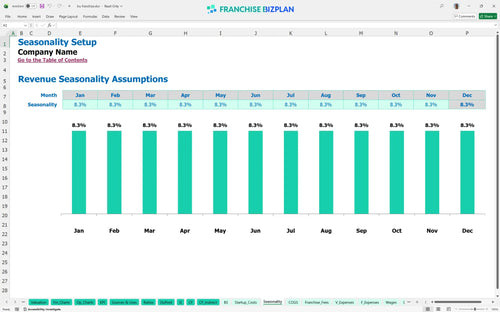
Researched revenue assumptions
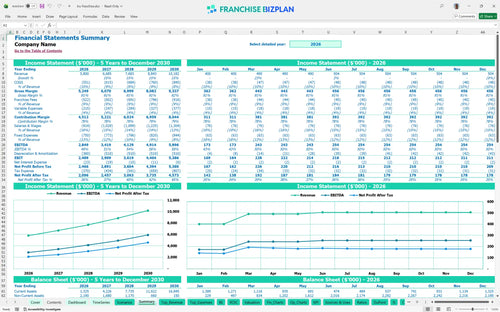
Lender-friendly financial outputs
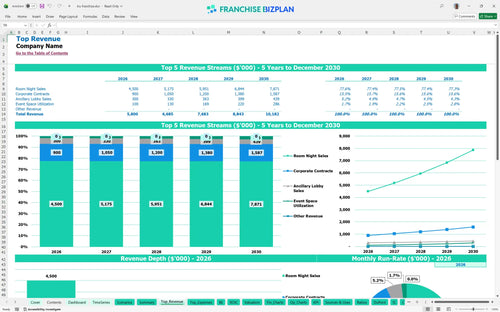
Revenue stream detailed view
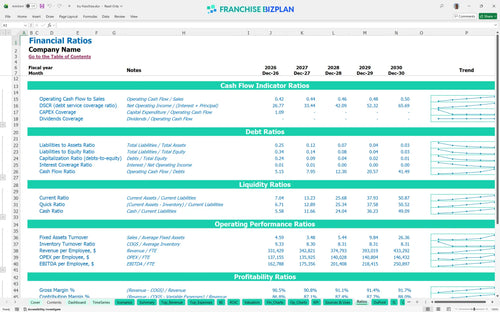
Performance metrics benchmark
We developed this Tru Franchise financial model based on deep research into midscale hotel operations and franchise disclosure documents. The pre-populated data covers everything from $5.8 million in year-one revenue to the $2.55 million initial investment, and every assumption is fully editable to match your specific territory. This tool gives you the precision needed to evaluate a 13.1% IRR and a 2-year payback period before committing capital.
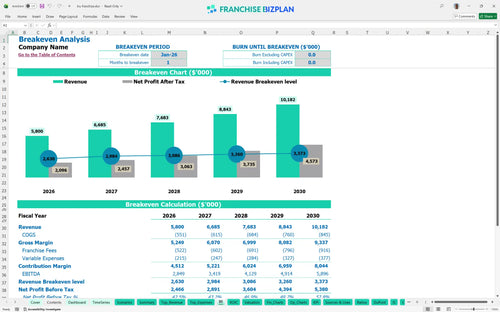
This unit hits the ground running with a break-even date of January 2026, essentially month one of operations. With Year 1 EBITDA (Earnings Before Interest, Taxes, Depreciation, and Amortization) projected at $2.84 million, the model shows immediate positive cash flow. We defintely see profitability scaling as forecasting revenue for a new hotel franchise location grows from $3 million to over $5.2 million by year five.
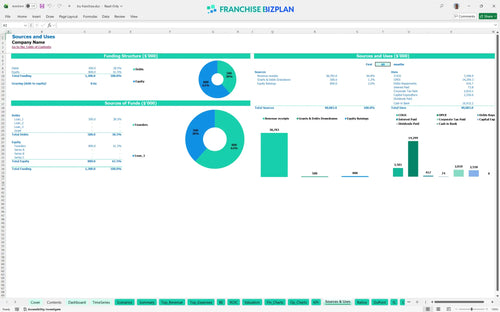
Launching this hotel franchise financial model requires a total initial investment of approximately $2.55 million in a capital expenditure budget. This hotel franchise pre-opening cost breakdown template covers everything from the $100,000 franchise fee to the $800,000 leasehold improvements. You'll also need to account for a $150,000 minimum cash buffer to handle early-stage working capital needs during the ramp-up phase.
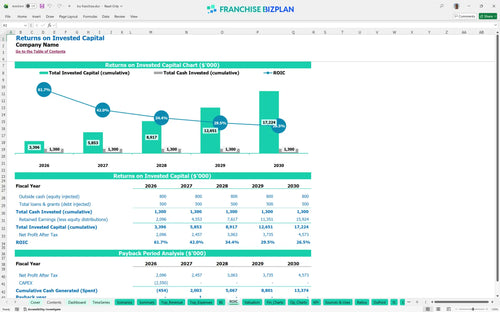
The hotel franchise investment return calculator projects an Internal Rate of Return (IRR) of 13.1% and a Return on Equity (ROE) of 19.91%. When calculating ROI for hotel real estate development, a 2-year payback period is a relatively fast recovery of your initial $2.55 million investment. Here's the quick math: by year two, your cumulative EBITDA of over $6.2 million far exceeds the initial build-out costs.
You reach break-even in just 1 month, which is exceptionally fast for a hotel startup cost calculator. This assumes you hit your $3 million room night sales target in year one while managing $30,000 in monthly lease payments and $15,000 in utilities. The biggest driver for staying above break-even is maintaining your occupancy rate and keeping OTA (Online Travel Agency) commissions at the projected 2.5%.
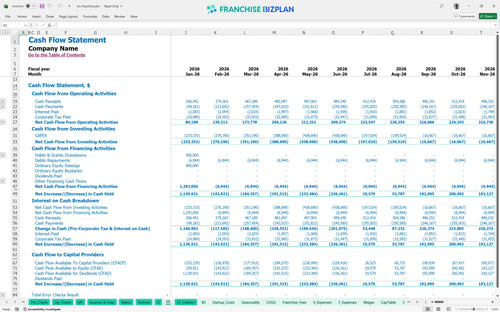
Your lowest cash point is projected to be $150,000 in June 2026 during the initial build-out phase. When financial modeling for boutique hotel startup scenarios, you must account for the timing gap between the $800,000 leasehold improvements and the start of room revenue. Still, the fast ramp-up to $5.8 million in year-one revenue provides a solid safety net once the doors are open.
In a high-growth scenario where corporate contracts exceed the $600,000 year-one estimate, your ROE could jump significantly. This Excel template for hotel franchise operating expenses allows you to stress-test your $120,000 GM salary and 5% royalty fee against lower revenue to see when cash flow turns negative. High-case outcomes depend on maximizing event space utilization and upselling ancillary lobby products.
Finance: update unit break-even and payback model by Friday.
This midscale hotel financial feasibility study template is built in Excel to be fully adaptable, allowing you to swap out assumptions as your local market conditions shift. You can adjust the pre-filled formulas for room rates or staffing levels to see how a 5% bump in occupancy affects your bottom line. It's a live tool for testing 'what-if' scenarios before you sign a lease or hire your first manager.

Planning for a single unit requires a long-term view of how RevPAR forecasting (Revenue Per Available Room) and occupancy scale over time. This franchise financial projection spreadsheet projects five years of performance, showing revenue climbing from $5.8 million in year one to over $10.1 million by year five. It maps out the full trajectory of your cash flow and includes a franchise unit profit and loss statement example to share with lenders.

Franchise economics live and die by the top-line skim, so we built specific logic for budgeting for hotel franchise royalty and marketing fees. With a franchise royalty fee structure of 5% and a 4% marketing fund, you'll be sending roughly $522,000 back to the brand annually on $5.8 million in sales. This model ensures these costs are baked into your monthly cash flow so there are no surprises when the bill comes due.

You need to know exactly how much skin in the game is required before the doors open at your new location. By using this tool to learn how to calculate startup costs for a hotel franchise, you can see that the $100,000 initial fee and $1 million for FF&E (Furniture, Fixtures, and Equipment) create a significant upfront load. The tool also incorporates hotel occupancy rate modeling to show the exact volume needed to cover your $30,000 monthly rent.

Don't guess on your guest amenities or housekeeping supply costs; use our built-in benchmarks to stay grounded. We've set housekeeping supplies at 6% of revenue initially, which is a standard starting point for operational expense management in midscale lodging. These guardrails help you identify margin leak early if your actual spending starts to drift from the model's researched targets.


Simply purchase and download the financial model template, then access it instantly using Microsoft Excel or Google Sheets. No installation or technical expertise required-just open and start working.

Enter your business-specific numbers, including revenue projections, costs, and investment details. The pre-built formulas will automatically calculate financial insights, saving you time and effort.

Leverage the investor-ready format to confidently showcase your financial projections to banks, franchise representatives, or investors. Impress stakeholders with clear, data-driven insights and professional reports.

Leverage the investor-ready format to confidently present your projections to banks, franchise representatives, or investors.