
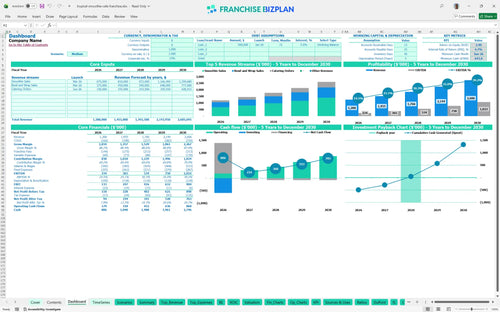
All-in-one Dashboard
Core inputs and core outputs


This Excel template for restaurant franchise financial forecasting includes a full CAPEX schedule, 5-year P&L, and a detailed break-even calculator for your new location.
Core inputs and core outputs
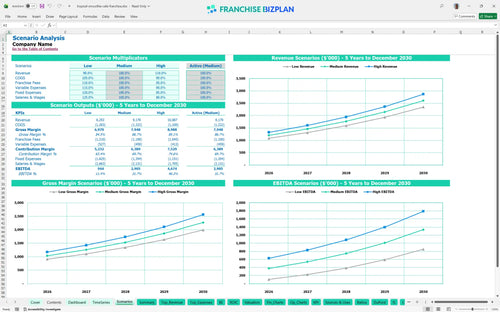
Three scenario analysis
Presentation ready
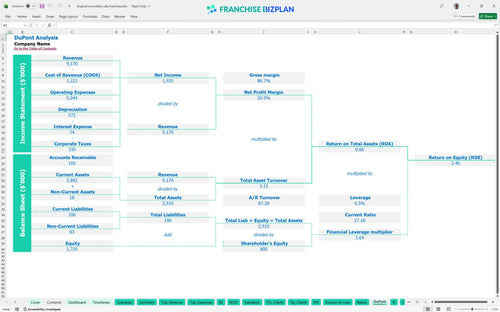
DuPont analysis
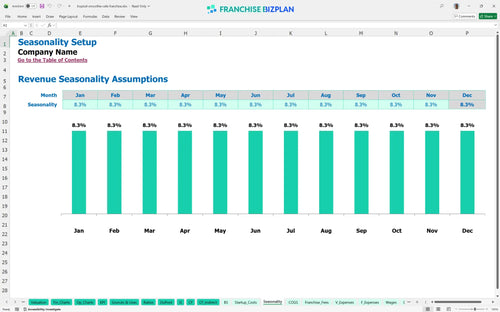
Researched revenue assumptions
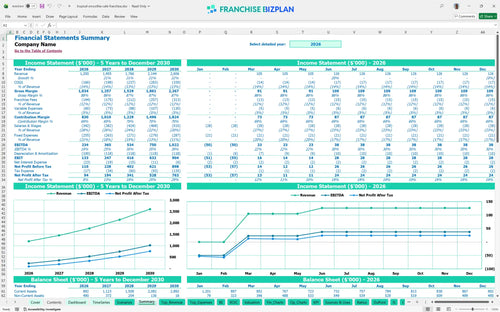
Lender-friendly financial outputs
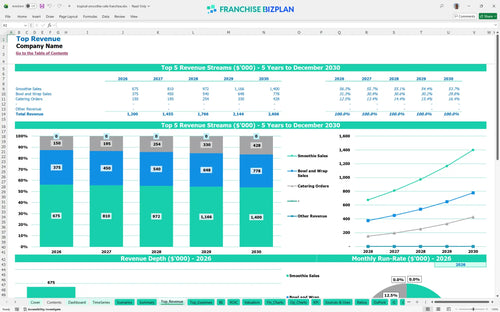
Revenue stream detailed view
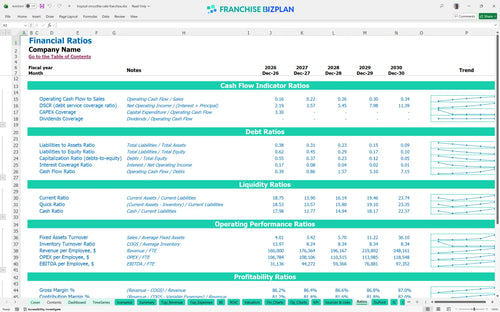
Performance metrics benchmark
We developed this model based on a deep franchise disclosure document analysis to ensure the $35,000 initial fee and 12% total fee load are accurate. The pre-filled data covers everything from the $15,000 monthly rent to the $1.2 million Year 1 revenue target, but you can adjust every line to match your local market reality. This tool helps you move from a rough estimate to a bank-ready projection in minutes.
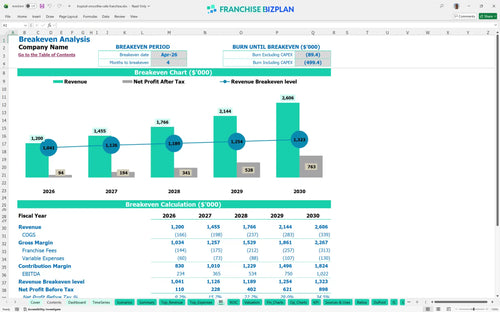
This franchise unit becomes profitable quickly, hitting its monthly break-even point in April 2026. By calculating net profit after the 6% royalty, 6% marketing fund, and food costs that start at 12%, the financial model for fast-casual restaurant business shows EBITDA scaling from $234,000 in Year 1 to over $1 million by Year 5.
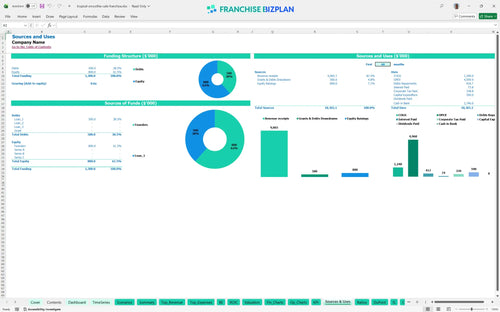
Launching this unit in the US requires a total capital expenditure budget of $590,000, plus a cash buffer for ramp-up. This startup budget template for local franchise business includes the $35,000 franchise fee and $250,000 for leasehold improvements to secure a high-visibility location.
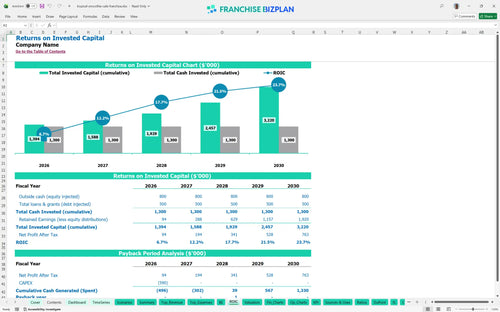
Investors can expect a 3-year payback period and an internal rate of return (IRR) of 4.66% based on the ROI calculation. While the initial ROE is 2.4, analyzing return on investment for food service franchises shows that the store-level margin improves as revenue grows toward the $2.6 million mark in Year 5.
The unit hits its monthly break-even analysis target in April 2026, just four months after the January start. The primary driver for this is the $15,000 monthly rent, which requires consistent daily volume from both smoothie and food sales to cover the fixed overhead.
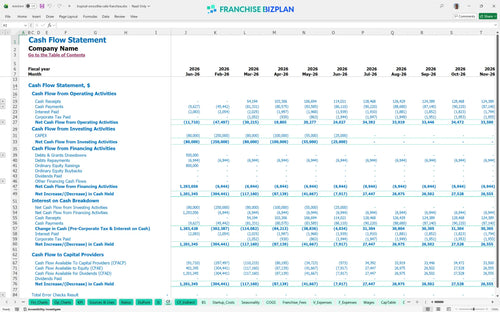
Your franchise unit cash flow projection template shows the lowest cash point hitting $643,000 in June 2026. You defintely need to keep a close eye on this, plus calculating labor and inventory costs for smoothie shops accurately is the only way to avoid a mid-year squeeze during the catering ramp-up.
The operating expense forecast adjusts instantly when you toggle between Low, Medium, and High performance cases to see how Year 1 margins shift. A High scenario shows that maximizing the $285,610 catering target by Year 5 significantly boosts your overall return on investment and shortens the payback timeline.
Finance: update unit break-even and payback model by Friday.
This franchise financial model template is built in Excel with open formulas, so you can tweak every assumption to fit your specific territory. Honestly, most models are too rigid, but this one lets you edit everything from seasonal traffic swings to local labor rates without breaking the logic. It is the fastest way to see how a shift in average ticket or staffing affects your bottom line.

This franchise business plan template provides a clear roadmap from your first smoothie sale to a mature operation. By Year 5, the model projects revenue reaching $2,606,000, but you need to see the year-by-year climb to manage your cash properly. Knowing how to project revenue for a new franchise location helps you stay ahead of hiring needs and equipment upgrades.

This restaurant financial projection spreadsheet automatically calculates the 6% royalty and 6% marketing fund contributions based on your gross sales. Estimating royalty and marketing fees for franchise units is vital because these off-the-top costs directly impact your daily take-home pay. The model ensures you never overlook these recurring obligations when calculating your store-level margin.

Understanding your smoothie shop startup costs is the first step toward a successful launch. This model details the $590,000 total capital expenditure, including the $250,000 leasehold improvements and $120,000 for kitchen equipment. Knowing how to calculate startup costs for a smoothie franchise allows you to secure the right amount of financing before you sign a lease.

This franchise unit profitability analysis uses built-in benchmarks, like food costs starting at 12%, to help you sanity-check your projections. It is the best financial spreadsheet for multi-unit franchise owners who need to compare performance across different territories. You can quickly see if your labor or occupancy costs are out of line with typical fast-casual standards.


Simply purchase and download the financial model template, then access it instantly using Microsoft Excel or Google Sheets. No installation or technical expertise required-just open and start working.

Enter your business-specific numbers, including revenue projections, costs, and investment details. The pre-built formulas will automatically calculate financial insights, saving you time and effort.

Leverage the investor-ready format to confidently showcase your financial projections to banks, franchise representatives, or investors. Impress stakeholders with clear, data-driven insights and professional reports.

Leverage the investor-ready format to confidently present your projections to banks, franchise representatives, or investors.