
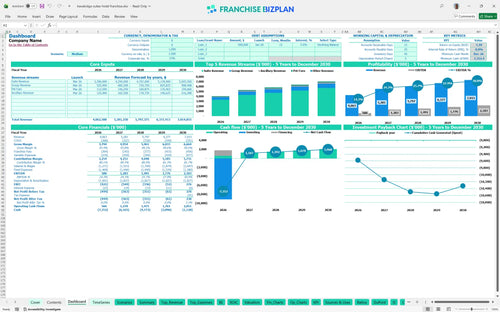
All-in-one Dashboard
Core inputs and core outputs


This hotel franchise financial model Excel template provides a complete toolkit for projecting revenue, managing expenses, and evaluating the total return on your hospitality investment.
Core inputs and core outputs
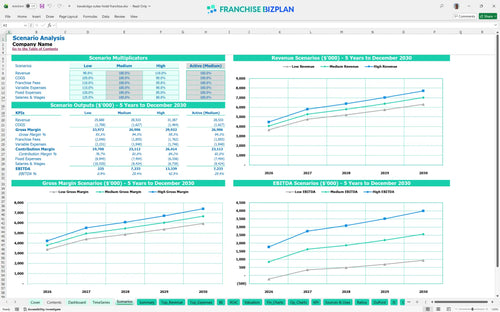
Three scenario analysis
Presentation ready
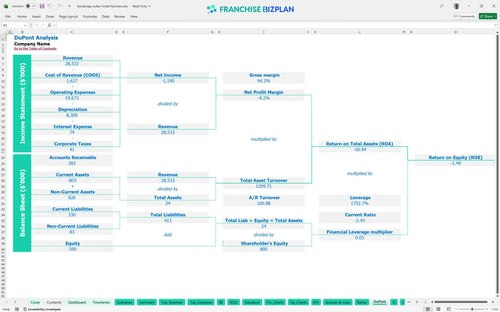
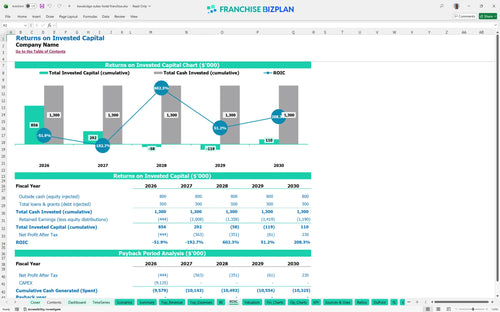
DuPont analysis
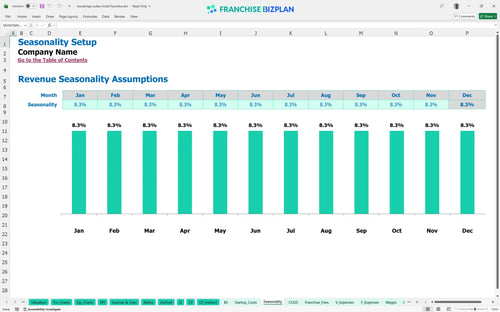
Researched revenue assumptions
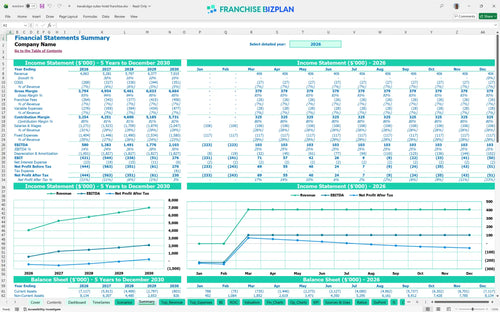
Lender-friendly financial outputs
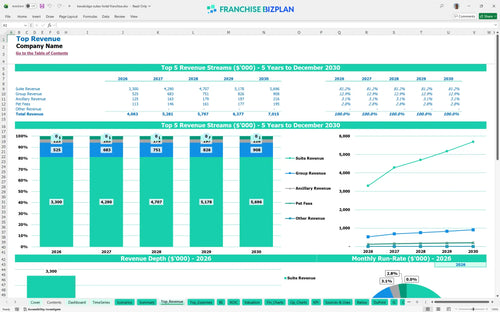
Revenue stream detailed view
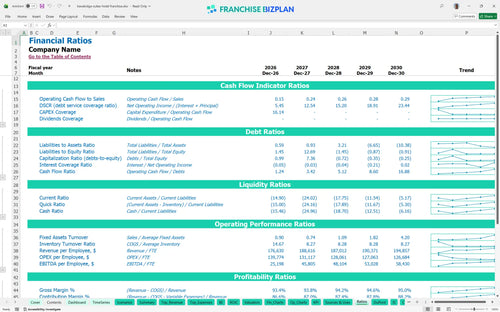
Performance metrics benchmark
We built this franchise unit financial model using our own research to ensure it reflects the reality of running a high-volume suite hotel. Key assumptions like the $2.2 million initial suite revenue, 4.5% royalty fees, and $1.2 million in equipment costs are pre-populated and fully editable. This tool helps you move from guessing to knowing your store-level EBITDA and cash flow needs.
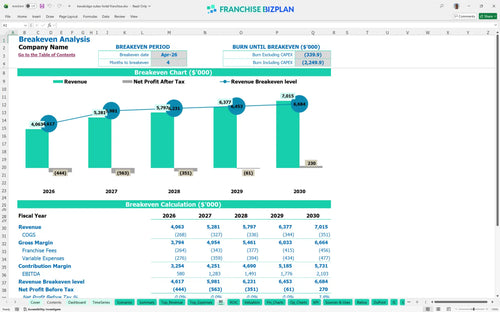
Based on the data, the unit hits a positive EBITDA of $580,000 in the first year, scaling to over $2.1 million by year five. While the model shows a breakeven date in April 2026, the heavy initial investment in leaseholds and furnishings means you need to manage margins tightly. Profitability depends on balancing the 4.5% royalty with high-margin streams like pet fees and ancillary sales.
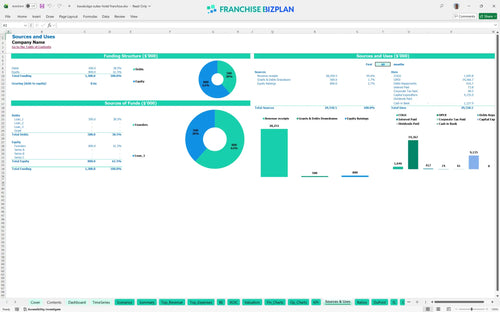
To launch this unit, you are looking at a significant capital outlay, primarily driven by $4.5 million in leasehold improvements and $1.8 million in furnishings. The total initial investment also covers the $35,000 franchise fee and a $500,000 contingency reserve. You will need a solid hotel franchise startup cost analysis to secure financing for these heavy upfront assets.
This hotel franchise investment return on investment calculator shows a payback period extending beyond five years due to the high build-out costs. The IRR currently sits at -0.79%, suggesting that long-term value depends heavily on terminal value or multi-unit scaling. Still, with year 5 EBITDA exceeding $2 million, the cash flow profile becomes much more attractive as the debt service declines.
The unit reaches its monthly break-even point in April 2026, just four months after the suite revenue launch. The primary driver for this is the high fixed cost structure, including $60,000 in monthly rent and $150,000 for a General Manager. To hit this faster, you must maximize occupancy early through the brand's central reservation system.
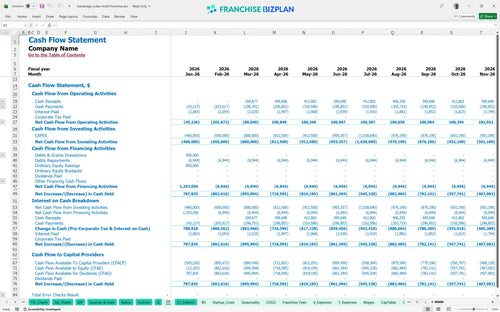
The lowest cash point is projected at -$7.35 million in December 2026, reflecting the massive cash outlay for construction and initial staffing. You defintely need a robust cash flow projection for a hotel franchise to manage this gap. We recommend a significant opening cash buffer to handle the timing gap between CAPEX payments and stabilized suite revenue.
Estimating operating expenses for a suite hotel franchise varies wildly between scenarios; a 10% drop in occupancy can push the payback period out by years. In the high scenario, increased group revenue and pet fees significantly improve the year-1 margin and shorten the path to a positive ROE. The model allows you to toggle these levers to see how sensitive your IRR is to ADR fluctuations.
This hotel franchise financial model is built in Excel, meaning you can tweak every variable to fit your specific market. It uses pre-filled formulas and editable assumptions so you can test different occupancy rates or suite pricing without breaking the sheet. Honestly, a model is only as good as its inputs, so we made it easy to swap out local labor rates or utility costs.

Planning a hospitality project requires a long view, which is why this tool provides detailed 5-year revenue and cost forecasts. You get a clear look at how your hotel franchise startup cost analysis translates into long-term cash flow and profit. It covers everything from initial ramp-up to mature-year performance, giving you the data needed for a hotel investment feasibility study.

This franchise financial projection spreadsheet tracks every dollar owed to the brand, from the initial $35,000 fee to ongoing 4.5% royalties. We also bake in the 2% marketing fund contribution so you see the true store-level margin after brand obligations. It's vital to know how these fees impact your bottom line before you sign the agreement.

Figuring out how to calculate startup costs for a hotel franchise is the first hurdle for any operator. This model aggregates $4.5 million in leasehold improvements, $1.8 million in furnishings, and technology systems into a clear total investment view. Plus, the franchise unit break-even analysis template shows exactly when your monthly revenue covers your $60,000 rent and other fixed costs.

We included essential financial metrics for hotel franchise owners to help you sanity-check your numbers against industry standards. Whether it's guest amenity supplies starting at 3.8% or laundry costs at 2.8%, these benchmarks keep your projections grounded in reality. Use these to see if your labor or occupancy costs are out of line with typical hospitality performance.


Simply purchase and download the financial model template, then access it instantly using Microsoft Excel or Google Sheets. No installation or technical expertise required-just open and start working.

Enter your business-specific numbers, including revenue projections, costs, and investment details. The pre-built formulas will automatically calculate financial insights, saving you time and effort.

Leverage the investor-ready format to confidently showcase your financial projections to banks, franchise representatives, or investors. Impress stakeholders with clear, data-driven insights and professional reports.

Leverage the investor-ready format to confidently present your projections to banks, franchise representatives, or investors.