
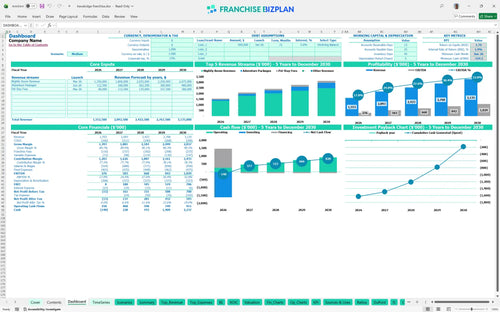
All-in-one Dashboard
Core inputs and core outputs


This financial model template for budget hotel franchise provides a comprehensive roadmap for tracking every dollar from pre-opening to year five.
Core inputs and core outputs
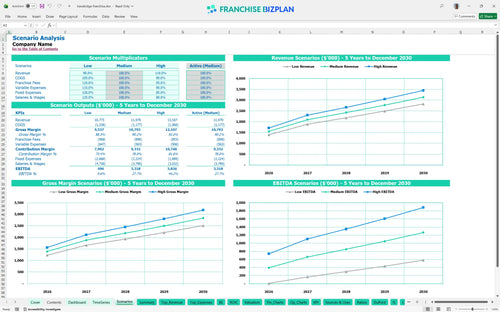
Three scenario analysis
Presentation ready
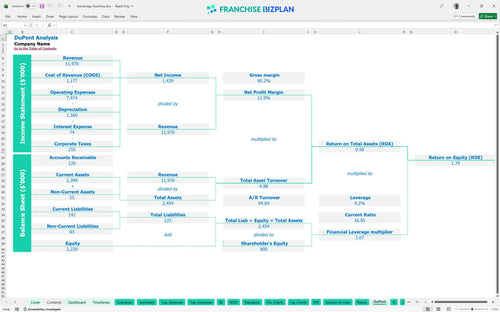
DuPont analysis
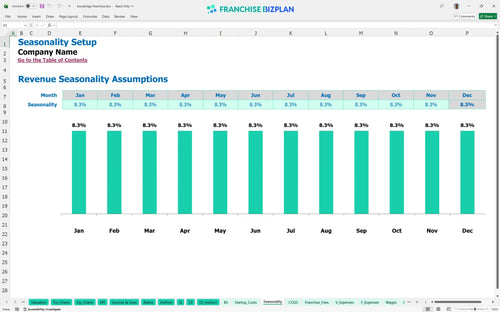
Researched revenue assumptions
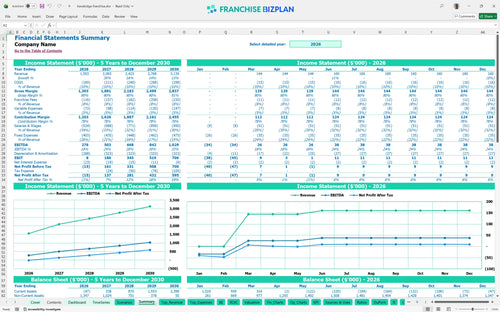
Lender-friendly financial outputs
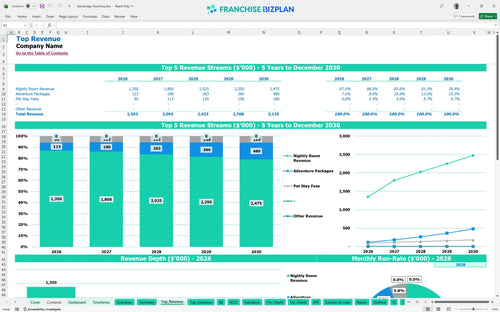
Revenue stream detailed view
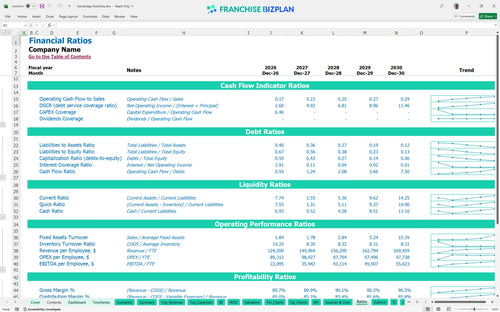
Performance metrics benchmark
We designed this hotel franchise financial model based on extensive research into budget-friendly adventure lodging. It includes pre-filled assumptions for room revenue, pet fees, and adventure packages, with year-one revenue starting at $1.55 million. Every input is fully editable, so you can tailor the projections to your specific mountain or roadside location.
This hospitality franchise starts generating positive EBITDA of $276,000 in its first year, reaching $1.029 million by year five. While the unit hits monthly break-even quickly, the high initial CAPEX means your net profitability trajectory is a multi-year build. Profitability is a marathon, not a sprint.
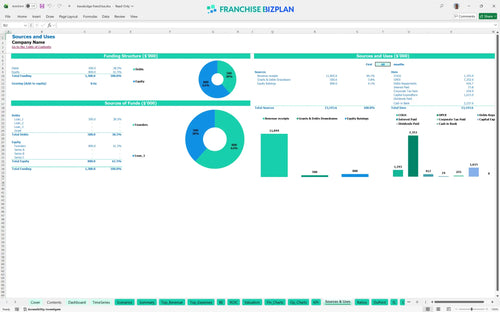
You need a total initial investment of $1,615,000 to launch this unit, which we've detailed in the hotel franchise initial investment breakdown template. This covers everything from the $35,000 brand fee to the $800,000 needed for leasehold improvements. Cash out the door happens long before the first guest checks in.
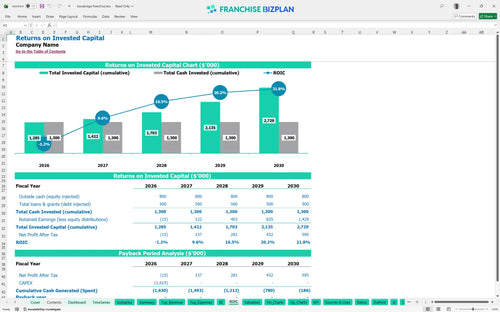
Estimating ROI for a hospitality franchise shows an internal rate of return (IRR) of 1.92% for this concept. While the payback period extends beyond year five, the return on equity of 1.79 suggests a stable long-term asset. Real estate and hospitality are long-term equity plays.
The unit hits its monthly break-even point in April 2026, just four months after the initial launch. Your ability to cover the roughly $79,000 in monthly fixed costs depends heavily on hotel occupancy rate forecasting and maintaining an average ticket that includes adventure add-ons. Volume is the only way to outrun high fixed rent.
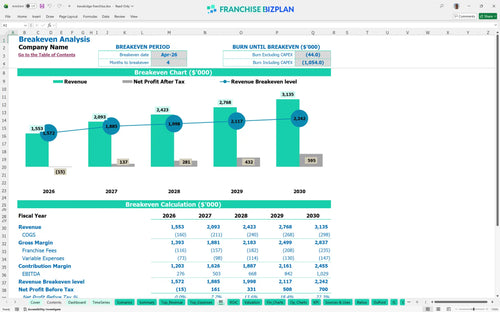
Your lowest cash point hits $324,000 in the red by June 2026, so you defintely need a buffer. This financial forecasting for adventure travel lodging accounts for the ramp-up period where expenses outpace early room revenue. The lowest cash point is your highest risk zone.
Our hotel franchise revenue projection spreadsheet allows you to toggle between Low, Medium, and High performance cases. In the High case, hitting $3.1M in year-five revenue significantly improves your IRR and shortens the payback window. Scenarios are your 'what-if' insurance policy.
This hotel franchise financial model is built in Excel with open formulas, letting you swap out every assumption from nightly rates to local labor costs for a deep franchise profitability analysis. You can adjust the room count or seasonal occupancy to see how it hits your bottom line in real-time. Every cell is open for your own data.

Mapping out a 60-month window is vital for a hospitality investment calculator because hotel ramp-ups take time. This model tracks your revenue climb from $1.55M in year one to over $3.1M by year five, giving you a clear view of long-term equity building. Five years is the standard for hotel debt cycles.

We've baked in the specific franchise royalty fee structure, including a 4.5% royalty and a 3.0% marketing fee. This ensures you see exactly how much of your $2.4M year-three revenue stays in your pocket after brand obligations are met. Royalties are a top-line tax you can't ignore.

Use this franchise startup cost spreadsheet to visualize the $1.6M+ initial outlay, covering everything from the $35,000 entry fee to $800,000 in leasehold improvements. Knowing your break-even sales level helps you manage the early months when cash is tight. You can't manage what you don't measure.

We use real-world data to set guardrails for guest supplies at 7.5% and linen laundry at 2.8%. These franchise unit performance metrics help you spot if your hotel operational overhead is drifting too far from industry norms. Benchmarks keep your manager honest.


Simply purchase and download the financial model template, then access it instantly using Microsoft Excel or Google Sheets. No installation or technical expertise required-just open and start working.

Enter your business-specific numbers, including revenue projections, costs, and investment details. The pre-built formulas will automatically calculate financial insights, saving you time and effort.

Leverage the investor-ready format to confidently showcase your financial projections to banks, franchise representatives, or investors. Impress stakeholders with clear, data-driven insights and professional reports.

Leverage the investor-ready format to confidently present your projections to banks, franchise representatives, or investors.