
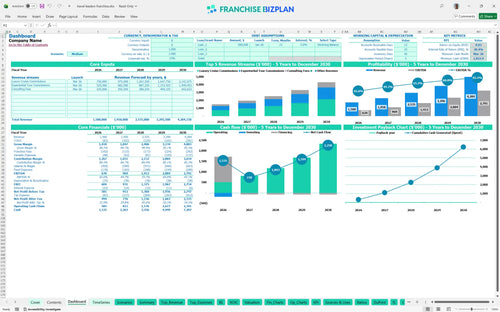
All-in-one Dashboard
Core inputs and core outputs


The franchise unit financial model template includes an Excel template for travel agency financial projections, covering everything from VR lounge setup costs to multi-year EBITDA growth.
Core inputs and core outputs
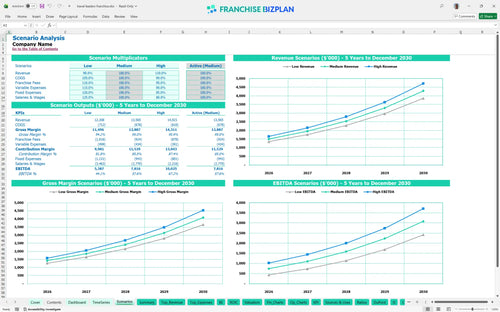
Three scenario analysis
Presentation ready
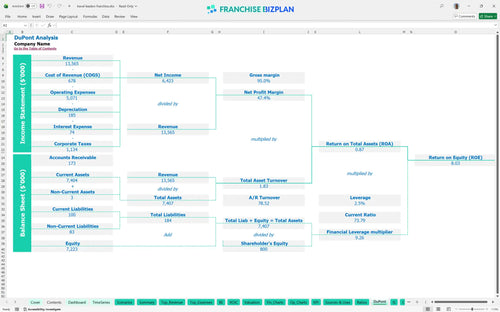
DuPont analysis
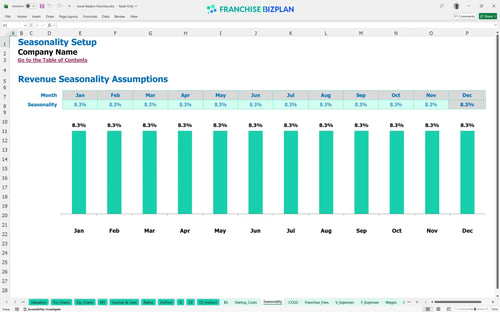
Researched revenue assumptions
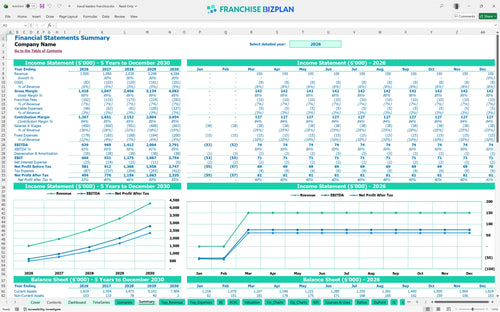
Lender-friendly financial outputs
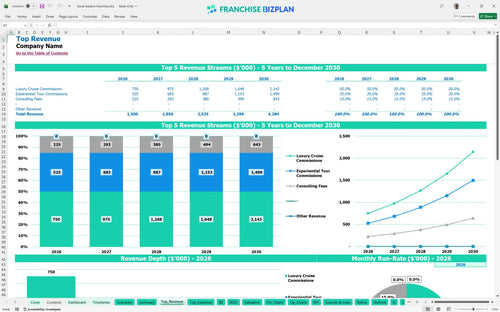
Revenue stream detailed view
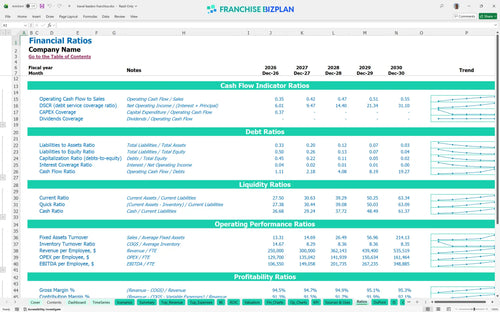
Performance metrics benchmark
We built this franchise unit financial model using our own research into the luxury travel sector and franchise standards. Key assumptions, including the $1.5 million Year 1 revenue target and the 4.81% royalty structure, are pre-populated and fully editable to match your specific territory. This model provides a credible roadmap for navigating the high-margin world of experiential travel and luxury cruise commissions.
The unit shows strong early performance with an EBITDA of $639,000 in the first year, scaling to $2.79 million by Year 5. This luxury travel franchise profit margin analysis assumes you scale from 2.0 to 4.0 travel advisors to handle the volume. Profitability will defintely depend on maintaining a high average ticket for luxury cruises and experiential tours.
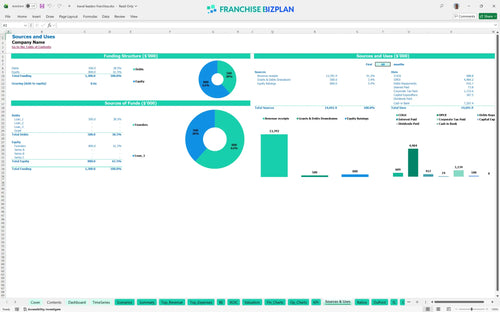
You need approximately $187,500 for the initial build-out and setup, plus a significant cash buffer for the ramp-up phase. This small business financial planning for travel advisors ensures you cover the $60,000 in leasehold improvements and $35,000 for the VR Discovery Lounge setup. Total cash requirements peak early as you fund the premium location rent and expert staff salaries.
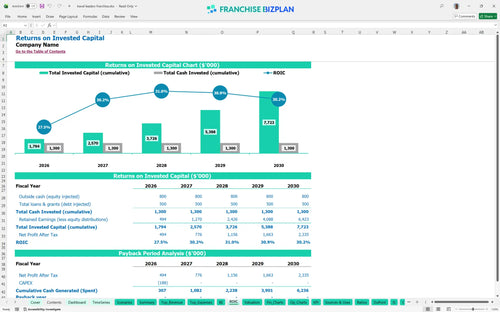
Calculating ROI for a new franchise location shows an Internal Rate of Return (IRR) of 20.41% and a Return on Equity (ROE) of 8.03%. While the unit generates significant annual EBITDA, the total payback period extends after Year 5 due to the high initial working capital and premium operating costs. This is a long-term equity play rather than a quick-cash flip.
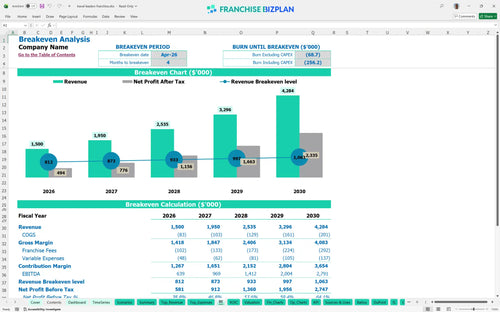
The unit reaches its monthly break-even point in April 2026, just four months after launching commissions. The primary driver for this quick transition is the high revenue-per-booking from luxury cruises, which offsets the $9,500 monthly rent. Creating a pro forma income statement for a franchise helps you visualize this transition from startup losses to positive cash flow.
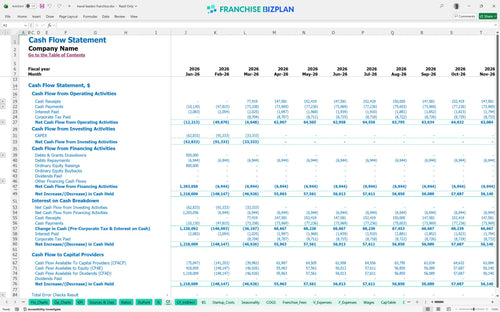
The lowest cash point occurs in March 2026, with a minimum cash balance of $1,023,000 including the initial funding. This model suggests a deep runway is necessary to support the high fixed costs of a luxury storefront and a $330,000+ annual payroll. Operating expense forecasting for luxury retail franchises is critical here to avoid liquidity crunches during the first quarter.
In the high scenario, aggressive revenue growth toward the $4.2 million Year 5 mark significantly boosts the 20.41% IRR. A low-performance scenario, where luxury cruise commissions lag, would push the break-even date further out and require a larger cash injection. Using a franchise business plan spreadsheet template allows you to stress-test these scenarios against your fixed $13,800 monthly overhead.
Finance: update unit break-even and payback model by Friday
This franchise financial model is a flexible Excel tool designed to handle the specific nuances of a travel consultancy. It features pre-filled formulas and editable assumptions, allowing you to swap out revenue drivers or adjust local labor rates without breaking the logic. Whether you are building a travel agency business plan template for one location or a small chain, the logic scales with your needs.

Success in the travel sector requires looking past the first year of commissions. This franchise unit profit and loss template provides a detailed 5-year outlook, mapping revenue growth from $1.5 million in Year 1 to over $4.2 million by Year 5. It integrates financial forecasting for your balance sheet and cash flow, ensuring you see the long-term impact of every booking and fee.

Franchise economics live and die by the top-line deductions. This model specifically tracks the 4.81% royalty and 2% marketing fund contributions against your gross commissions. By using this franchise investment analysis, you can see exactly how much cash remains after the brand takes its cut, helping you manage the real-world costs found in a typical franchise disclosure document.

Launching a luxury travel hub involves more than just a desk; you need to account for leasehold improvements and high-end tech. This franchise startup cost calculator aggregates your $187,500 in initial capital expenditures (CAPEX) and compares them against monthly operating expenses. It provides a clear break-even analysis so you know exactly which month your commissions will finally cover the rent.

We have integrated unit-level economics for franchise business owners to help you validate your projections against industry standards. The model includes benchmarks for luxury travel advisor salaries and premium retail rent, such as the $9,500 monthly lease for a high-traffic location. This allows you to sanity-check your margins and ensure your expense forecasting for luxury retail franchises remains realistic.


Simply purchase and download the financial model template, then access it instantly using Microsoft Excel or Google Sheets. No installation or technical expertise required-just open and start working.

Enter your business-specific numbers, including revenue projections, costs, and investment details. The pre-built formulas will automatically calculate financial insights, saving you time and effort.

Leverage the investor-ready format to confidently showcase your financial projections to banks, franchise representatives, or investors. Impress stakeholders with clear, data-driven insights and professional reports.

Leverage the investor-ready format to confidently present your projections to banks, franchise representatives, or investors.