
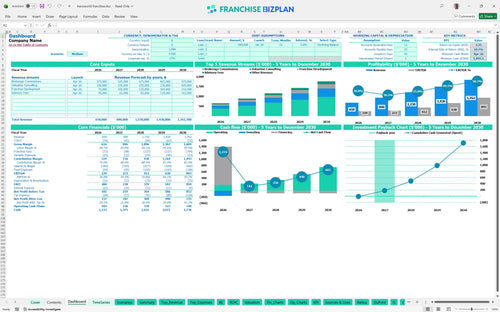
All-in-one Dashboard
Core inputs and core outputs

This franchise unit financial model template provides a complete Excel-based framework for projecting brokerage commissions, valuation fees, and professional service overhead over a five-year horizon.
Core inputs and core outputs
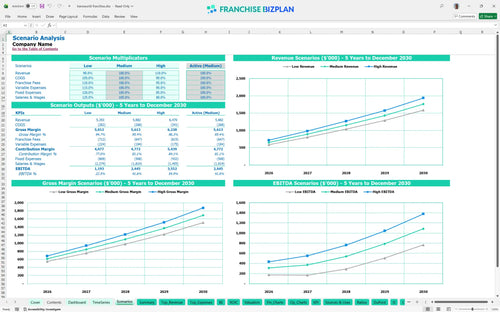
Three scenario analysis
Presentation ready
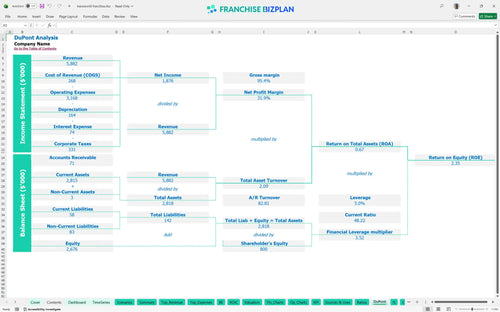
DuPont analysis
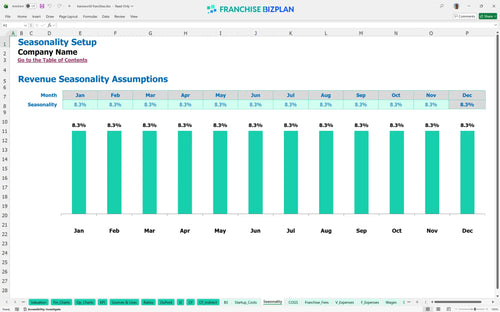
Researched revenue assumptions
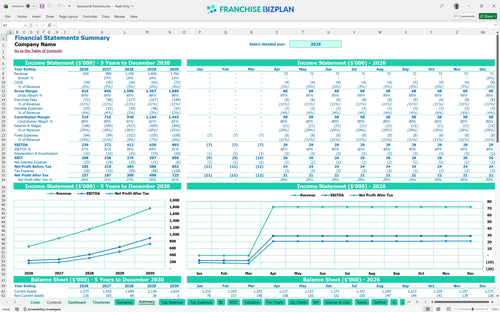
Lender-friendly financial outputs
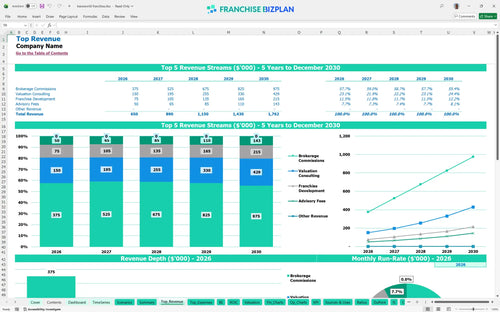
Revenue stream detailed view
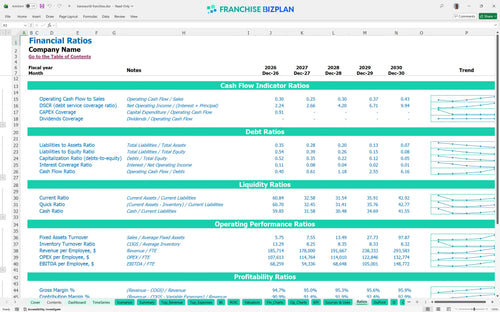
Performance metrics benchmark
We built this franchise unit financial model using our own research into the brokerage and advisory sector. Key assumptions like the $67,500 franchise fee and revenue streams from brokerage commissions and valuation consulting are pre-populated and fully editable. The model shows a year-one revenue of $650,000, helping you evaluate the real-world feasibility of this professional services investment.
Profitability for this unit is projected to start in April 2026. After accounting for the 10% royalty, marketing fees, and a professional payroll that includes a $85,000 lead broker, the model shows EBITDA growing from $239,000 in year one to $893,000 by year five.
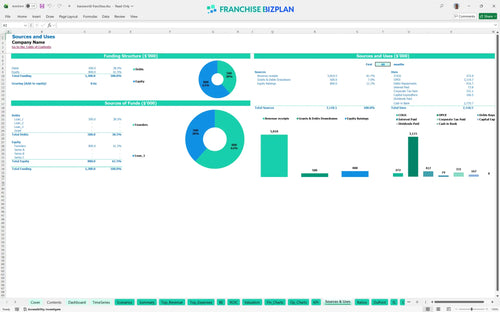
Launching this unit in the US requires an initial capital outlay of approximately $166,500 for assets and fees. This includes the $67,500 franchise fee and $25,000 for office improvements, but you also need to plan for the minimum cash requirement of $1,095,000 to handle the ramp-up phase.
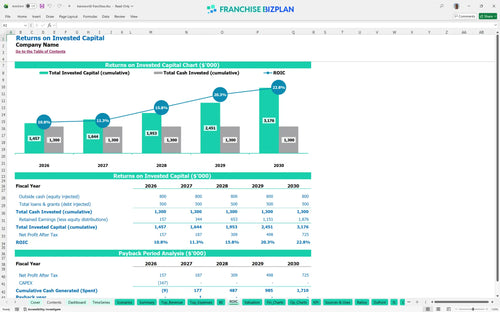
Investors can expect an Internal Rate of Return (IRR) of 10.69% and a Return on Equity (ROE) of 2.35. The payback period is 2 years, which is defintely a strong result for a business broker business plan template focusing on high-margin advisory services.
The monthly break-even point is reached in April 2026, roughly 4 months after opening. The primary driver for hitting this goal is the volume of brokerage commissions, which must cover the $5,500 monthly rent and the $85,000 lead broker salary.
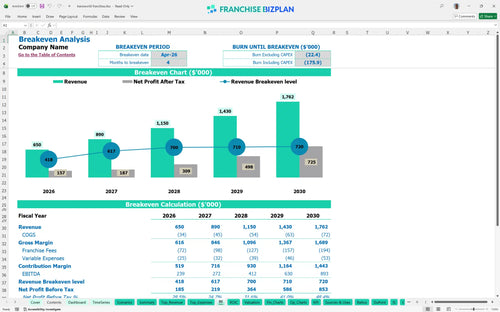
The lowest cash point is $1,095,000 in April 2026, meaning you need about 4 months of heavy runway before the unit becomes self-sustaining. Still, you should keep a buffer to manage the timing gaps between closing business sales and receiving commission checks.
In a High scenario where revenue exceeds the $650,000 year-one target, the 2-year payback period could shorten significantly. Conversely, a Low scenario makes the 11% total franchise fees and $5,500 monthly rent much harder to absorb, potentially pushing the break-even date further out.
Finance: update unit break-even and payback model by Friday.
This franchise financial model template is built in Excel to give you total control over your numbers. You can adjust pre-filled formulas and editable assumptions to match your specific territory, whether you are looking at a single unit or a small professional services chain. It simplifies the math so you can focus on the actual business brokerage startup costs and local market potential.

Planning for the long haul requires more than just a first-year guess. This tool provides a detailed 5-year revenue, cost, and cash flow outlook tailored for a professional services firm. It helps you see how scaling from one associate to a full team impacts your franchise unit profit and loss template over time, ensuring you stay ahead of your long-term profitability goals.

Managing the franchise royalty fee structure is critical for maintaining your store-level margin. The model tracks the 10% royalty and 1% marketing fund contributions automatically based on your projected revenue streams. This ensures you understand exactly how much of your $650,000 year-one revenue stays in your pocket after the franchisor takes their cut.

Calculating startup costs for a service-based franchise is often trickier than it looks because of the working capital needed for professional staff. This model covers everything from the $67,500 initial fee to office build-out and tech setup. You will get a clear franchise unit break-even analysis that shows exactly when your monthly commissions will finally cover your fixed overhead.

We have included benchmarks for professional services so you can sanity-check your estimates against real-world performance. Whether you are looking at occupancy costs for a premium office or labor percentages for associate brokers, these metrics help you verify that your franchise financial projection spreadsheet is grounded in reality rather than just optimism.


Simply purchase and download the financial model template, then access it instantly using Microsoft Excel or Google Sheets. No installation or technical expertise required-just open and start working.

Enter your business-specific numbers, including revenue projections, costs, and investment details. The pre-built formulas will automatically calculate financial insights, saving you time and effort.

Leverage the investor-ready format to confidently showcase your financial projections to banks, franchise representatives, or investors. Impress stakeholders with clear, data-driven insights and professional reports.

Leverage the investor-ready format to confidently present your projections to banks, franchise representatives, or investors.