
All-in-one Dashboard
Core inputs and core outputs


This model includes detailed revenue drivers for rooms and lounges, comprehensive staffing plans, and automated CAPEX schedules to evaluate your hotel investment.
Core inputs and core outputs
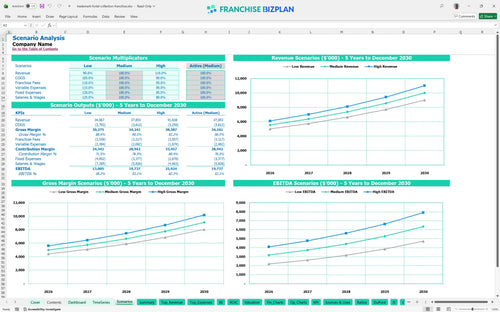
Three scenario analysis
Presentation ready
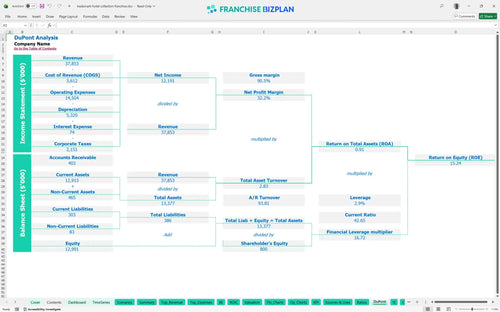
DuPont analysis
Researched revenue assumptions
Lender-friendly financial outputs
Revenue stream detailed view
Performance metrics benchmark
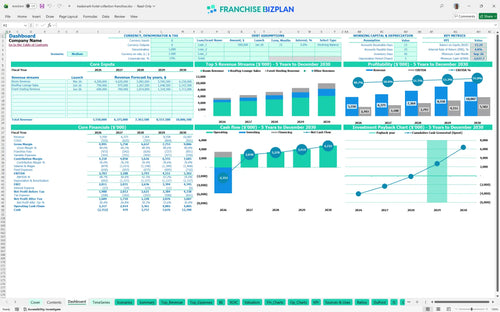
We built this boutique hotel investment template using our own research into upscale hospitality units. Key assumptions including room revenue starting at $2.8M and a $2.5M leasehold budget are pre-populated with researched data and are fully editable. This tool helps you analyze the 5.5% royalty structure and 4.81% IRR to ensure the deal makes sense for your portfolio.
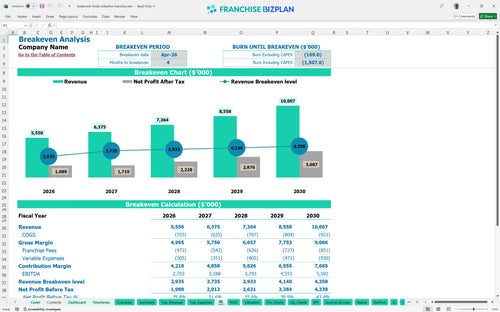
Profitability for this unit depends on balancing high fixed costs like the $25,000 monthly rent against growing revenue streams. Based on the data, the unit hits break-even in April 2026, just four months after the January start, assuming you hit your Year 1 revenue target of $5.55M. Speed to break-even is your best defense against high fixed rent.
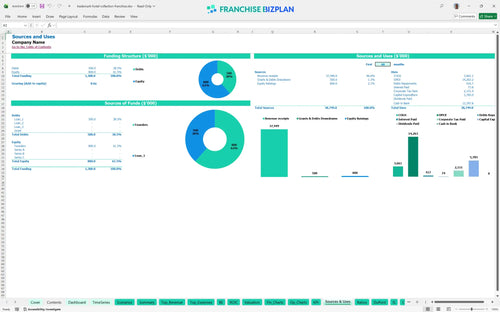
Launching this unit requires substantial capital, primarily for the $2.5M leasehold improvements and $1.2M in furniture and fixtures. Total CAPEX includes a $35,000 franchise fee and $900,000 for the rooftop lounge construction, which is a key revenue driver. Hard assets eat most of your checkbook before day one.
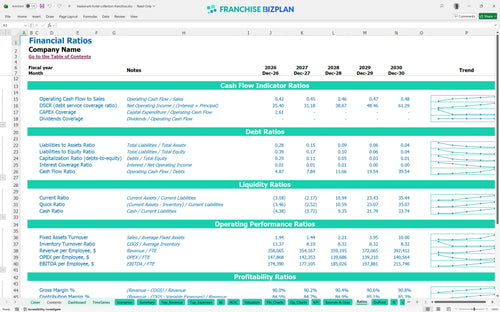
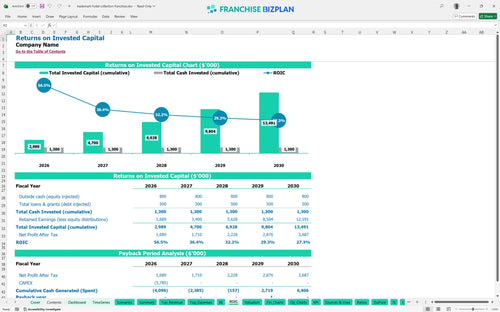
Investors can expect an Internal Rate of Return (IRR) of 4.81% and a Return on Equity (ROE) of 15.24%. The payback period is estimated at 4 years, which is standard for high-CAPEX hospitality projects with significant build-out costs. Patience is a requirement when your payback is measured in years, not months.
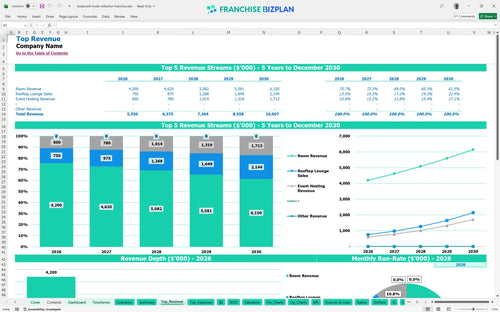
Monthly break-even occurs in April 2026, but the margin for error is slim due to the $25,000 monthly rent and 4% OTA commissions. Volume is the biggest lever here, especially for the rooftop lounge which adds $500,000 in Year 1 sales. Occupancy pays the bills, but lounge margins buy the yacht.
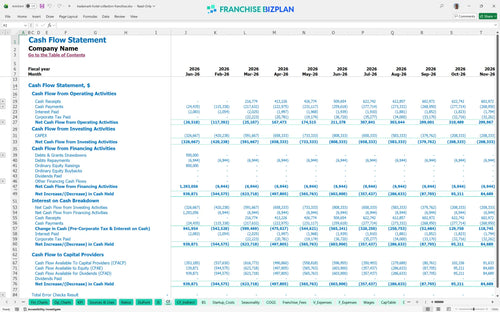
The lowest cash point is -$2.628 million in September 2026, reflecting the heavy upfront CAPEX and construction timing. You need enough runway to cover the construction phase and the initial months of operation before the $2.7M Year 1 EBITDA kicks in. The valley of death in hotel cash flow is deep and expensive.
Moving from a medium to a high-performance scenario can push your Year 5 EBITDA toward $5.5M. The model allows you to toggle revenue and expense variables to see how a 10% lift in ADR affects your 4.81% IRR, as higher margins defintely shorten the 4-year payback period. Small margin gains in a $10M business create massive equity value.
Finance: update unit break-even and payback model by Friday
This hotel franchise financial model is built in Excel with fully editable formulas, allowing you to swap out room counts, ADR (Average Daily Rate), and local labor rates. You can adjust every assumption from seasonal occupancy to lounge margins to see how different operating scenarios impact your bottom line.

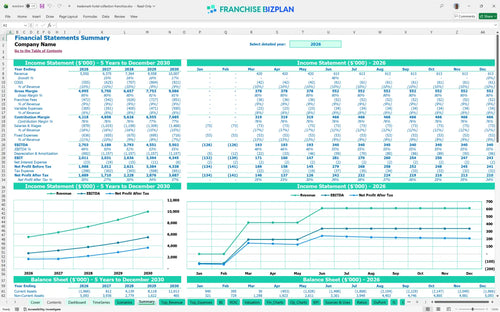
Plan for long-term growth with a detailed 5-year outlook that tracks your journey from a $5.55M Year 1 revenue to over $10M by Year 5. The model provides a clear view of cash flow and profitability, helping you manage the transition from a new opening to a mature, high-performing asset.

The model accurately tracks the real cost of your brand affiliation, including the 5.5% royalty fee and 3% marketing fund contribution. By automating these calculations against your monthly room and F&B revenue, you can see exactly how much cash stays in the unit after brand obligations.

Estimate your total entry cost with precision, from the $35,000 initial fee to the $2.5M leasehold improvement budget. This section helps you understand the capital stack required to launch and identifies the exact sales volume needed to cover your $25,000 monthly rent and fixed overhead.

Use built-in hospitality benchmarks to verify your staffing levels and operating costs against industry standards. This ensures your projections for housekeeping labor and utility spends are realistic, helping you avoid the common trap of underestimating the cost of premium guest services.


Simply purchase and download the financial model template, then access it instantly using Microsoft Excel or Google Sheets. No installation or technical expertise required-just open and start working.

Enter your business-specific numbers, including revenue projections, costs, and investment details. The pre-built formulas will automatically calculate financial insights, saving you time and effort.

Leverage the investor-ready format to confidently showcase your financial projections to banks, franchise representatives, or investors. Impress stakeholders with clear, data-driven insights and professional reports.

Leverage the investor-ready format to confidently present your projections to banks, franchise representatives, or investors.