
All-in-one Dashboard
Core inputs and core outputs


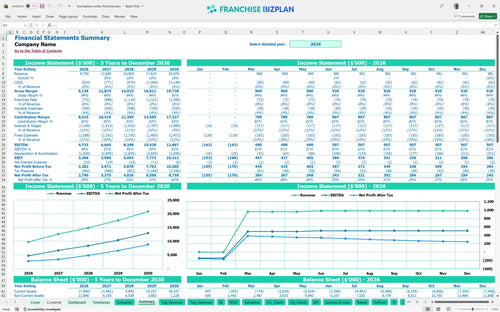
This comprehensive template includes a multi-year income statement, cash flow tracker, and specific hospitality franchise financial projection tools to manage extended-stay assets.
Core inputs and core outputs
Three scenario analysis
Presentation ready
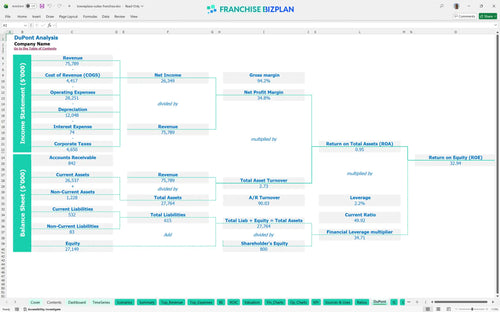
DuPont analysis
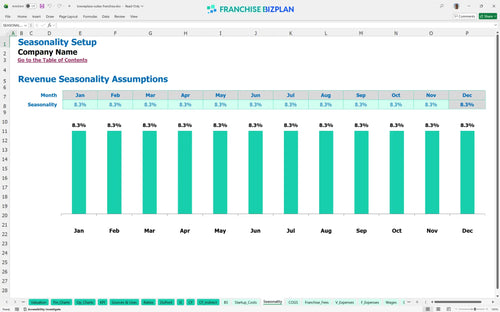
Researched revenue assumptions
Lender-friendly financial outputs
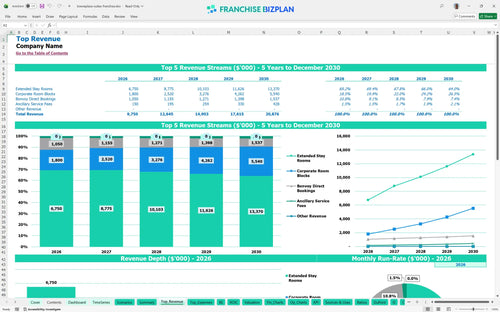
Revenue stream detailed view
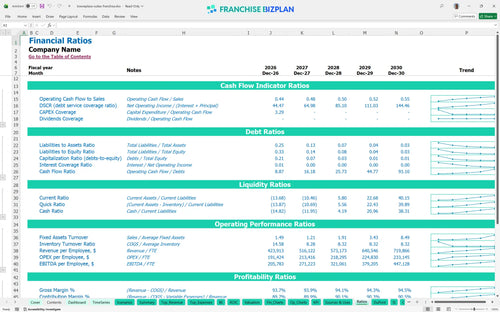
Performance metrics benchmark
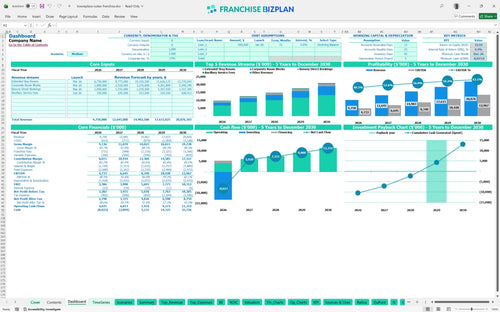
We built this hotel franchise unit financial model using our own deep-dive research into the extended-stay sector. Key assumptions, from corporate room block revenue to $38,000 housekeeping salaries, are pre-populated and fully editable to reflect your specific territory. With a Year 1 revenue target of $9.75 million, this model gives you the data-driven confidence to talk to lenders and partners.
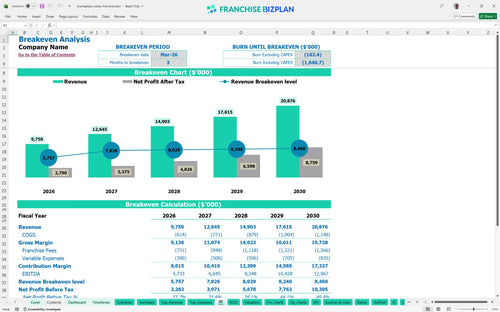
This franchise unit is projected to reach its break-even point in March 2026, just three months after launching. Profitability in hospitality is a game of occupancy and margin control. You will track net profit after accounting for the 5.5% royalty, 2% marketing fee, and significant fixed costs like the $95,000 monthly lease.
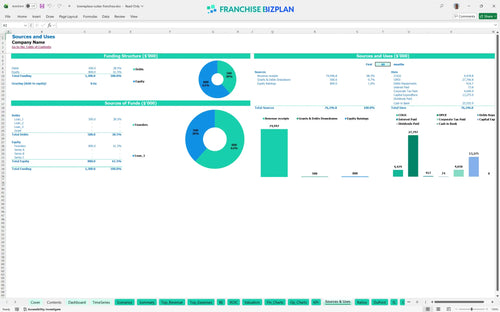
You need a significant capital stack to launch this unit, with the total investment driven by $6.5 million in leasehold improvements and $3.2 million for furniture, fixtures, and equipment. Build-out is your biggest check; write it with precision. The model also accounts for a $75,000 franchise fee and $1.8 million for kitchen suite appliances to meet brand standards.
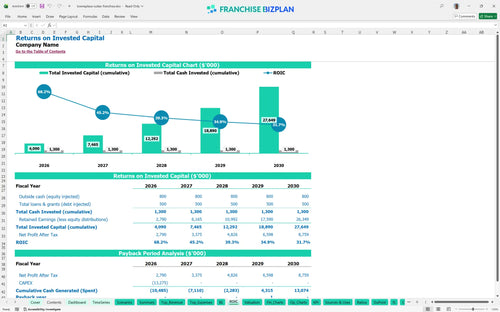
Investors can expect an Internal Rate of Return (IRR) of 4.44% and a Return on Equity (ROE) of 32.94% over the five-year hold. A 4-year payback is a solid target for extended-stay assets. This franchise investment return calculation Excel shows that while the initial cash outlay is high, the steady cash flow from corporate blocks stabilizes the long-term yield.
The unit hits break-even in March 2026, driven primarily by the high-volume extended-stay room revenue which starts at $4.5 million in Year 1. Break-even is about hitting that critical RevPAR (Revenue Per Available Room) floor quickly. Your ability to cover the $175,000+ in monthly fixed costs depends on maintaining steady corporate occupancy.
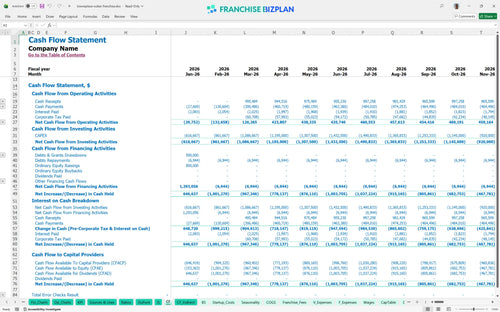
The lowest cash balance hits -$8.023 million in December 2026 during the heavy construction and ramp-up phase. Cash is oxygen, and the ramp-up phase is where most owners gasp for air. You defintely need to ensure your construction loan or equity partner can cover this peak deficit before the Year 2 revenue jump to $12.6 million kicks in.
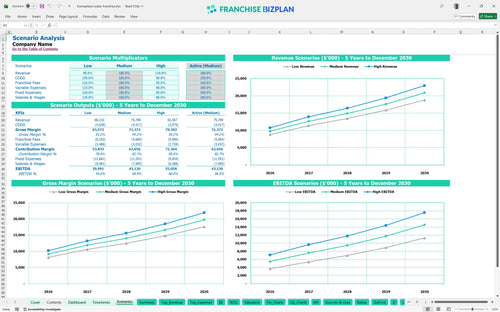
The model allows you to toggle between Low, Medium, and High scenarios to see how a 10% drop in RevPAR affects your 4-year payback. Scenarios prepare you for the 'what-ifs' before they become 'oh-nos'. A High case scenario driven by strong local marketing and corporate retention can significantly pull forward your Year 1 EBITDA of $4.73 million.
This hotel franchise financial model is a fully customizable Excel tool that lets you swap out every assumption to match your specific market. You can edit pre-filled formulas to test different occupancy rates or room prices, making it easy to adapt to your specific location and operating scenario. Excel shouldn't be a black box; it should be your roadmap.

Long-term planning is vital in hospitality, and this tool provides detailed 5-year revenue, cost, cash flow, and profit projections. You can map out your growth from the first check-in to a mature property, ensuring your franchise profitability analysis accounts for rising labor and utility costs over time. Five years is the standard horizon for hospitality debt and exit planning.

The model captures your specific financial obligations, including the $75,000 initial fee and ongoing 5.5% royalty payments. By including the 2% brand marketing fund contribution, you can see the real economics of the unit before you commit. Brand fees are the price of admission for global distribution. This franchise disclosure document analysis ensures no hidden costs surprise you later.

Planning your entry requires a clear view of the $6.5 million in leasehold improvements and $3.2 million in furniture and equipment. This franchise startup cost template helps you estimate the total initial investment and the monthly sales level required to cover your $95,000 monthly rent. Knowing your break-even keeps you from flying blind during the ramp-up.

This hotel business plan Excel incorporates industry benchmarks for key metrics like housekeeping supplies and laundry costs. You can sanity-check your assumptions against typical ranges to ensure your labor and occupancy costs stay competitive. Benchmarks act as the guardrails for your operational sanity.


Simply purchase and download the financial model template, then access it instantly using Microsoft Excel or Google Sheets. No installation or technical expertise required-just open and start working.

Enter your business-specific numbers, including revenue projections, costs, and investment details. The pre-built formulas will automatically calculate financial insights, saving you time and effort.

Leverage the investor-ready format to confidently showcase your financial projections to banks, franchise representatives, or investors. Impress stakeholders with clear, data-driven insights and professional reports.

Leverage the investor-ready format to confidently present your projections to banks, franchise representatives, or investors.