
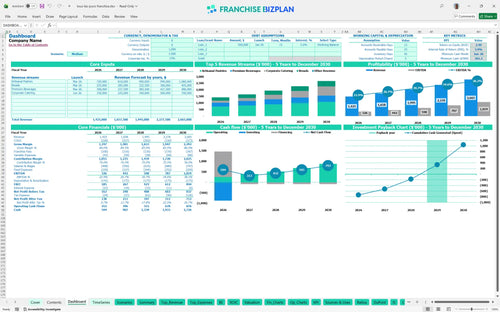
All-in-one Dashboard
Core inputs and core outputs


This professional franchise investment analysis tool provides a complete Excel-based framework for projecting revenue, managing startup costs, and calculating long-term ROI for a high-volume bakery unit.
Core inputs and core outputs
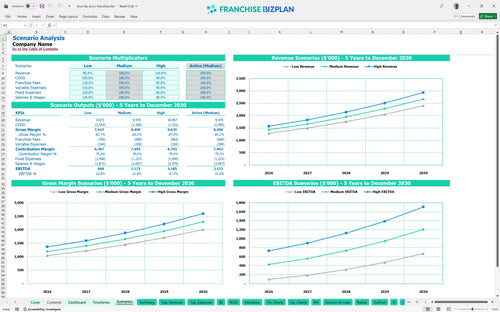
Three scenario analysis
Presentation ready
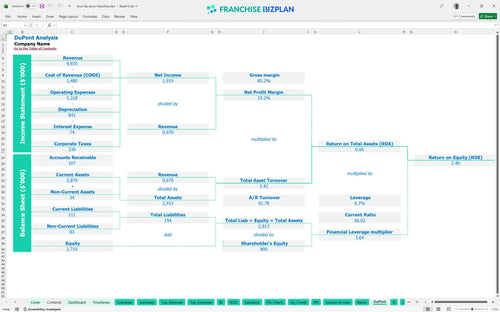
DuPont analysis
Researched revenue assumptions
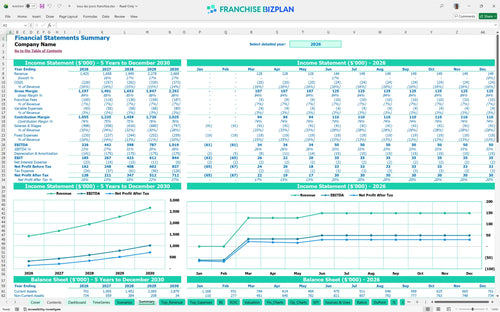
Lender-friendly financial outputs
Revenue stream detailed view
Performance metrics benchmark
We built this model using detailed research on high-end bakery operations to ensure your projections are grounded in reality. Key assumptions like the $1.425M year-one revenue and the 5% royalty fee are pre-populated but fully editable to match your specific territory. This tool helps you move from a rough idea to a precise bakery franchise profit and loss statement template in minutes.
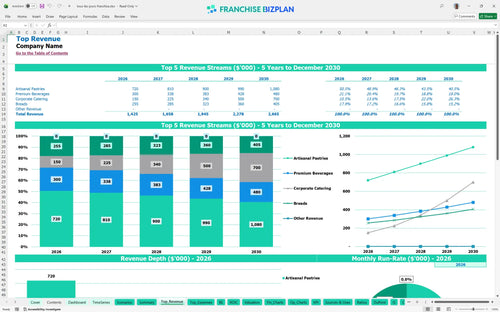
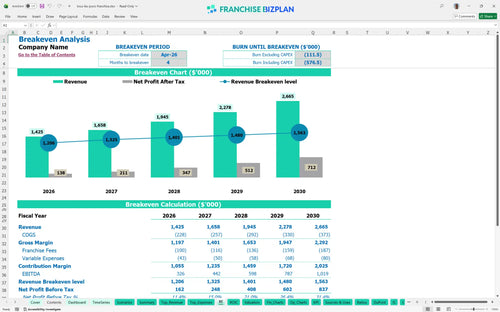
The unit hits its stride quickly, reaching a monthly break-even point by April 2026, just four months after the initial launch. While year-one EBITDA is a solid $326,000, the real profit acceleration happens in years three through five as corporate catering and artisanal pastry sales scale. Here is the quick math: by year five, net margins expand significantly as fixed costs like rent stay flat while revenue hits $2.665M. Managing labor efficiency is the fastest way to protect these gains.
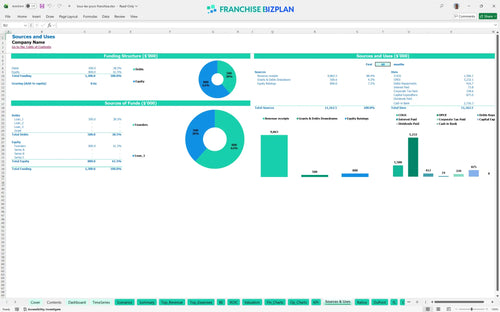
You will need approximately $875,000 in upfront capital to cover the physical build-out and franchise entry costs. This includes $320,000 for leasehold improvements and $220,000 for specialized bakery equipment. The model also accounts for a $365,000 minimum cash position to handle the ramp-up phase through mid-2026. Using an Excel template for bakery franchise startup costs ensures you don't miss small but critical items like the $55,000 POS and digital setup. Cash is oxygen during the first six months.
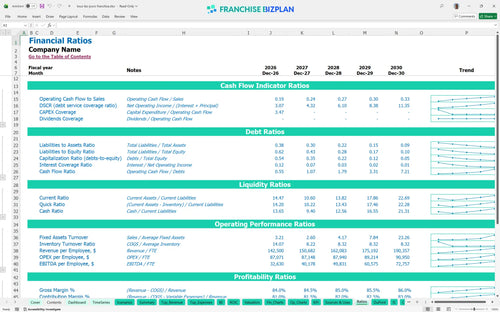
The franchise investment ROI calculator template shows a payback period of 4 years, which is standard for a high-CAPEX food service model. You are looking at an Internal Rate of Return (IRR) of 3.87% and a Return on Equity (ROE) of 2.4 based on the initial five-year forecast. While the IRR seems conservative, it reflects a fully-loaded cost structure including a $72,000 manager salary and professional head baker. To be fair, the real value is in the year-five EBITDA of $1.019M, which supports a strong exit multiple.

The unit reaches break-even in April 2026, driven by a diversified revenue mix of pastries, bread, and beverages. Your biggest hurdle is the $19,000 in monthly fixed costs, which includes $10,000 for rent and $2,500 for local marketing. How to calculate franchise unit profitability often comes down to the 'average ticket' and daily transaction count. If you can't hit the volume targets in the first 90 days, you will need to lean harder into the corporate catering channel to bridge the gap. Volume is the only cure for high fixed rent.
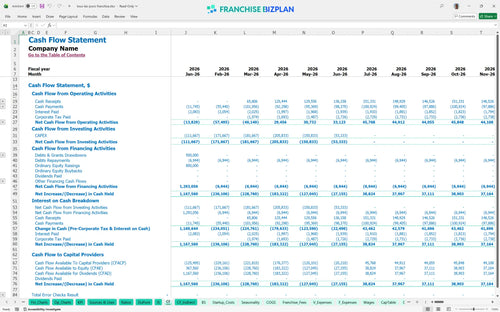
The lowest cash point occurs in June 2026, with a minimum cash balance of $365,000. This suggests you need a healthy buffer to survive the gap between construction spending and the start of full-scale operations. Estimating franchise operating expenses for business plans requires looking at the 'cash burn' before the catering revenue kicks in. If your equipment delivery is delayed by 30 days, that cash floor will drop quickly. Still, the model shows a strong recovery once the unit is fully staffed and operational.
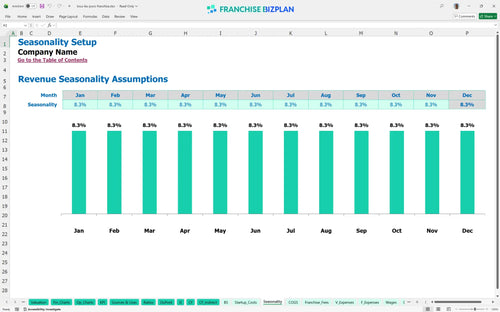
Financial forecasting for retail food franchises must account for volatility in ingredient prices and foot traffic. In a high-case scenario, where corporate catering exceeds targets, your year-one EBITDA could jump by 15%, significantly shortening the payback period. Conversely, a low-case scenario with higher labor costs would push the break-even date further into 2026. The model allows you to toggle these variables to see how a 2% shift in food costs impacts your total cash runway. Small tweaks in the model reveal big risks in the store.
This franchise financial model template is built in Excel to give you total control over your unit-level planning. You can swap out pre-filled data for your specific site costs, local labor rates, and actual lease terms without breaking the logic. It is defintely the fastest way to move from a generic business plan to a site-specific execution strategy. One-click updates allow you to see how a higher rent or a tighter labor market changes your bottom line instantly.

Success in a retail franchise revenue forecasting exercise requires looking past the grand opening. This model provides a full 60-month view, capturing the ramp-up phase and the transition into mature-unit performance. You get a clear look at how annual revenue climbs from $1.425M in year one to over $2.6M by year five. Long-term planning is about seeing the compounding effect of repeat customers and price adjustments. It turns a simple bakery franchise business plan into a multi-year growth roadmap.

Operating a branded unit means managing specific top-line deductions that a mom-and-pop shop doesn't face. This tool includes a dedicated franchise royalty fee calculation to track the 5% royalty and 2% marketing fund contributions. By automating these calculations, you can see exactly how much cash stays in the unit after the franchisor takes their cut. It is vital to understand these 'off-the-top' costs before you sign a lease. Every dollar sent to corporate is a dollar that must be offset by higher throughput or better margins.

The franchise startup cost calculator aggregates everything from your $40,000 initial fee to the $320,000 leasehold improvements. It maps out the $875,000 total capital requirement so you aren't surprised by equipment costs or signage bills during construction. Analyzing break-even points for new franchise units is the core of this section, showing you the exact sales volume needed to cover your $10,000 monthly rent and fixed overhead. Knowing your 'zero-profit' number helps you manage staff hours more effectively during slow weeks.

This unit economics model uses researched data to help you sanity-check your bakery franchise operational costs against industry norms. We have included realistic targets for food ingredients, which start at 14% and scale down as you gain purchasing power. If your labor or packaging costs drift too far from these benchmarks, the model flags it so you can investigate waste or scheduling issues. It is like having a seasoned CFO looking over your shoulder to ensure your projections stay grounded in reality. Real-world numbers beat optimistic guesses every single time.


Simply purchase and download the financial model template, then access it instantly using Microsoft Excel or Google Sheets. No installation or technical expertise required-just open and start working.

Enter your business-specific numbers, including revenue projections, costs, and investment details. The pre-built formulas will automatically calculate financial insights, saving you time and effort.

Leverage the investor-ready format to confidently showcase your financial projections to banks, franchise representatives, or investors. Impress stakeholders with clear, data-driven insights and professional reports.

Leverage the investor-ready format to confidently present your projections to banks, franchise representatives, or investors.