
All-in-one Dashboard
Core inputs and core outputs


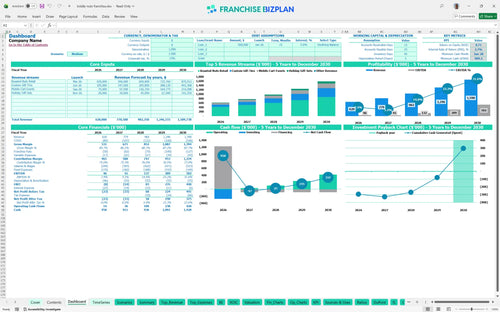
This Excel template for franchise financial planning provides a complete roadmap from the initial $27,500 franchise fee to a mature $1.5 million revenue stream.
Core inputs and core outputs
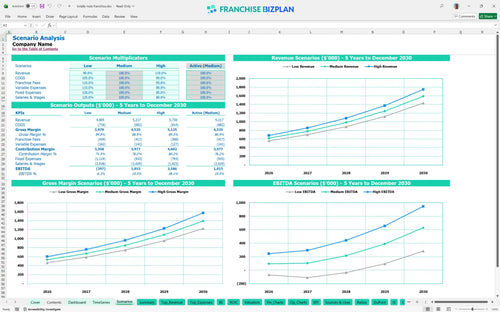
Three scenario analysis
Presentation ready
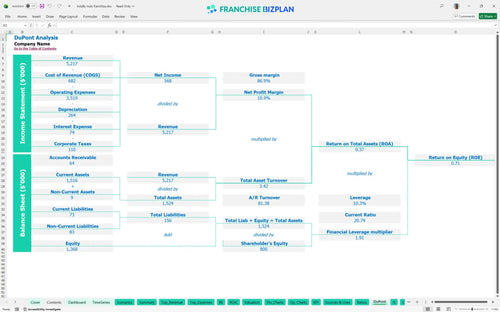
DuPont analysis
Researched revenue assumptions
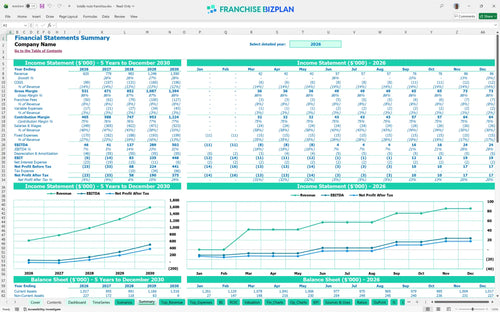
Lender-friendly financial outputs
Revenue stream detailed view
Performance metrics benchmark
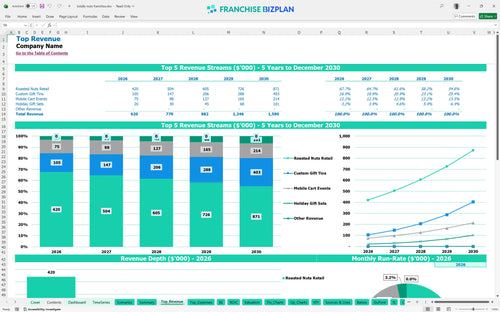
We built this franchise unit financial model using our own research into the roasted nut industry. Key assumptions like the $27,500 franchise fee and the $620,000 year-one revenue target are pre-populated and fully editable. This tool helps you map out the path to a $502,000 EBITDA by year five while keeping an eye on franchise unit economics.
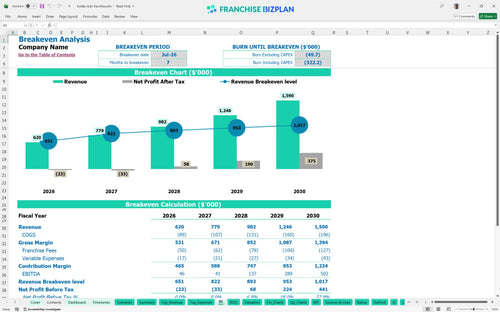
You will hit the break-even point by July 2026, just seven months after starting. While year one shows a $46,000 EBITDA, year two dips slightly to $41,000 as you scale staff, before jumping to $137,000 in year three. This model accounts for the 8% total royalty and marketing load plus the $9,500 monthly rent for a prime location.
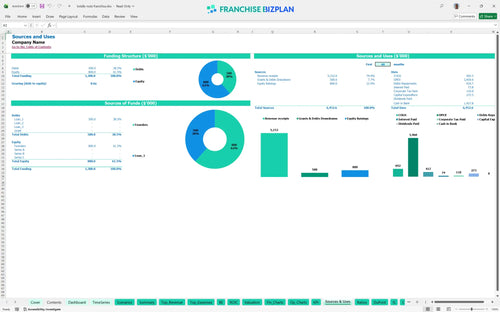
To launch this retail snack business, you will need $272,500 in upfront capital. This covers everything from the $27,500 franchise fee to $110,000 for leasehold improvements and $55,000 for roasting equipment. The food cart startup budget template also includes a mobile cart and POS system to ensure you are ready for both foot traffic and off-site events.
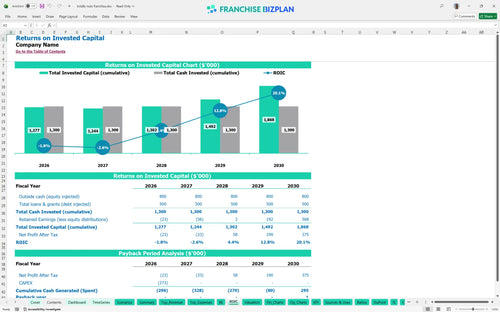
The franchise ROI analysis shows a 5-year payback period with an internal rate of return (IRR) of 2.66%. While the IRR is modest, the cash flow scales significantly, reaching over $500,000 in EBITDA by year five. This assumes you successfully transition from a single storefront to a multi-channel operation including corporate gifting and mobile events using this franchise investment analysis spreadsheet.
Your monthly break-even depends heavily on the $9,500 rent and the $110,000 annual management payroll. With raw material costs around 12%, you need to hit roughly $52,000 in monthly sales to cover all fixed and variable costs. This business plan financial model for new franchisees helps you track the primary driver: throughput.
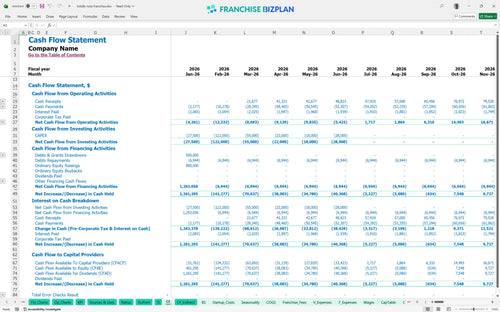
The lowest cash point is $909,000 in January 2028, showing a need for significant liquidity to handle the ramp-up phase. You will need a solid cash flow forecasting plan to manage the gap between the initial $272,500 investment and the high-growth years. This financial forecasting guide for franchise owners helps you prepare for when working capital pressure rises.
In a high-growth scenario, hitting $1.5 million in revenue by year five creates a massive $502,000 EBITDA. However, a low-growth case where event commissions or retail traffic lags could push the payback period well beyond five years. Preparing financial projections for a franchise requires looking at how a 10% drop in sales affects your ability to pay that $9,500 monthly rent.
This franchise financial model template gives you total control over the numbers in a standard Excel environment. You can tweak the pre-filled formulas and assumptions to match your specific territory, whether you are running a high-traffic storefront or a mobile unit. It is built to handle different operating scenarios so you can see how a shift in nut prices or labor hours changes your bottom line. Honestly, a model is only as good as your ability to break it and fix it.

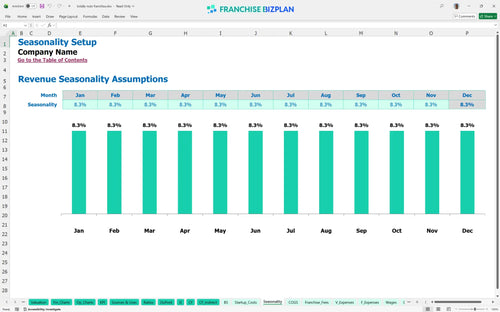
Planning a food franchise business plan requires looking past the grand opening to see how the unit matures over five years. This model tracks revenue scaling from $620,000 in year one to over $1.5 million by year five, accounting for seasonal spikes and multi-channel growth. You get a clear view of cash flow and profit margins to help you decide when to reinvest or pull cash out. Projections are just guesses, but these are educated ones.

Every dollar counts when you are paying a 6% royalty and a 2% marketing fund contribution off the top. This franchise unit financial projections tool automates these calculations so you see the exact impact on your store-level EBITDA. By tracking the $27,500 initial fee alongside ongoing brand costs, you can plan for the real cost of being part of a larger system. Brand standards are great, but they defintely come with a price tag.

Use this franchise startup cost calculator to map out the $272,500 needed for leaseholds, equipment, and fees. The model identifies your break-even sales level by pitting fixed costs like the $9,500 monthly rent against your variable margins. Knowing exactly how many roasted nut tins you need to sell to keep the lights on is the first step to sleeping better at night. Break-even is the most important milestone in your first year.

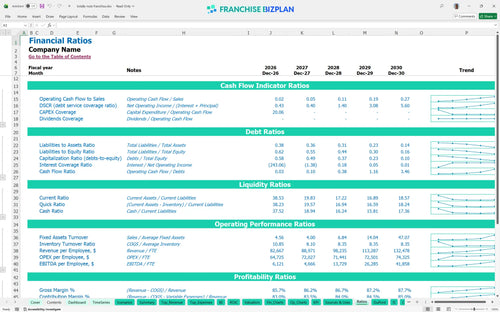
This small business profitability template includes built-in benchmarks to help you sanity-check your labor and occupancy costs. If your store manager's $62,000 salary or your 12.5% raw material cost feels high, you can compare it to typical retail snack business standards. It helps you spot margin leaks before they become floods in your operating expense spreadsheet. Good data stops you from lying to yourself about the numbers.


Simply purchase and download the financial model template, then access it instantly using Microsoft Excel or Google Sheets. No installation or technical expertise required-just open and start working.

Enter your business-specific numbers, including revenue projections, costs, and investment details. The pre-built formulas will automatically calculate financial insights, saving you time and effort.

Leverage the investor-ready format to confidently showcase your financial projections to banks, franchise representatives, or investors. Impress stakeholders with clear, data-driven insights and professional reports.

Leverage the investor-ready format to confidently present your projections to banks, franchise representatives, or investors.