


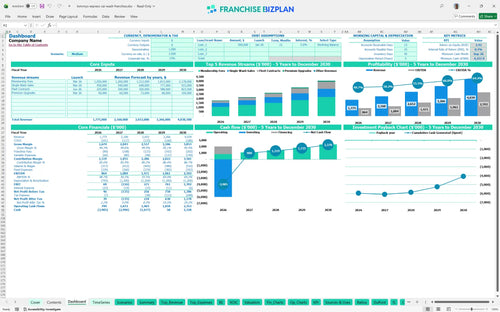
All-in-one Dashboard
Core inputs and core outputs



This franchise unit financial model excel template provides a complete toolkit for evaluating car wash franchise profitability through detailed revenue modeling and capital expenditure tracking.
Core inputs and core outputs
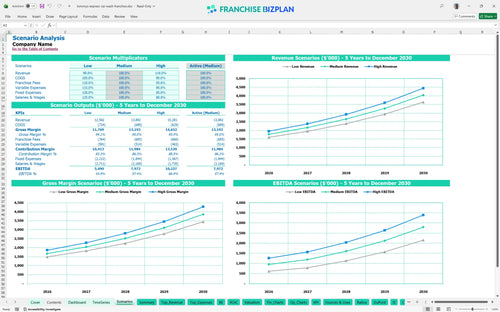
Three scenario analysis
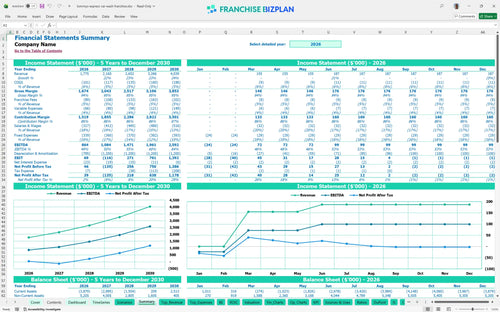
Presentation ready
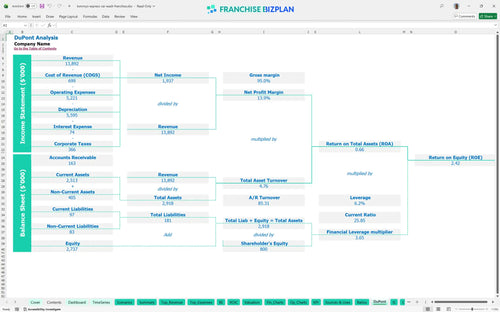
DuPont analysis
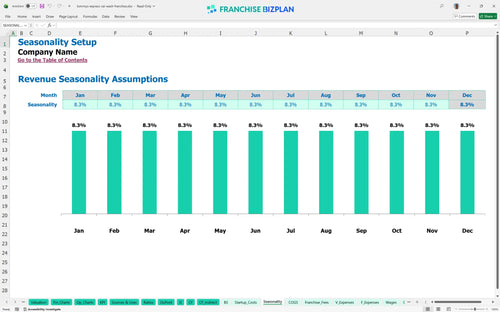
Researched revenue assumptions
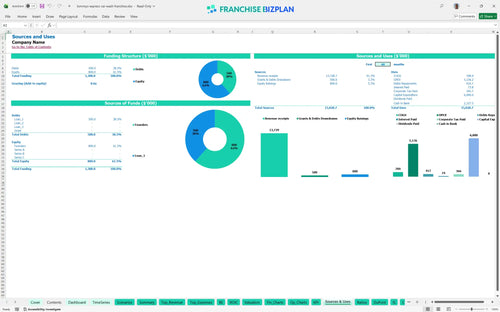
Lender-friendly financial outputs
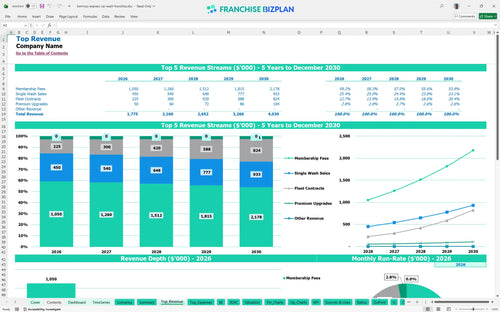
Revenue stream detailed view
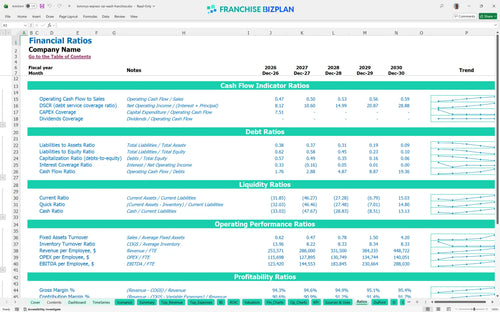
Performance metrics benchmark
We developed this franchise unit financial model using deep-dive research into the automated wash sector to ensure accuracy for operators. The model comes pre-populated with critical data like the $1.775 million year-one revenue target and specific capital expenditure needs for high-tech wash tunnels. All inputs, from the 4% royalty fee to the $18,000 monthly rent, are fully editable to match your specific territory and site conditions.
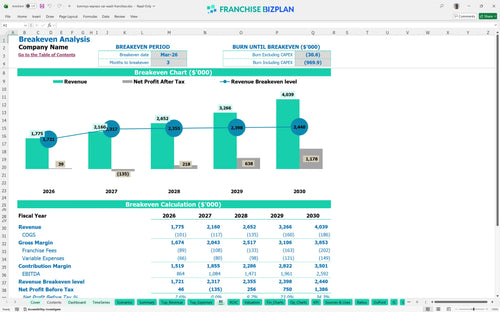
The franchise unit is projected to reach profitability very quickly, hitting its break-even date in March 2026, just three months after launch. With a year-one EBITDA of $864,000, the model shows a strong trajectory, though the high initial investment means the full payback occurs after year five. You will defintely need to maintain high membership conversion to keep this timeline on track.
The total capital expenditure for this unit is significant, driven by the iconic building design and advanced automated wash equipment. You will need to allocate $2.2 million for construction and $1.8 million for the wash tunnel machinery alone. The total initial investment, including the $50,000 franchise fee and water reclamation systems, sets the stage for a high-volume, premium operation.
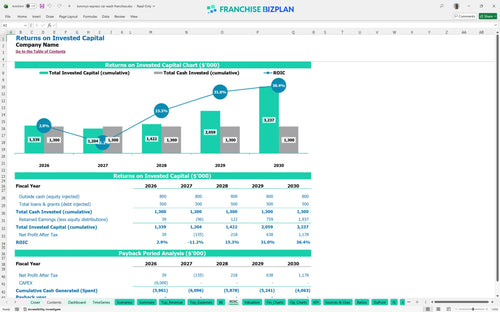
The automated car wash ROI is built on long-term recurring revenue, showing an Internal Rate of Return (IRR) of 0.7% and a Return on Equity (ROE) of 2.42. While the payback period extends beyond the five-year mark due to the $6 million+ in startup costs, the EBITDA grows to $2.592 million by year five. This suggests a high-value asset with strong cash-on-cash potential once the initial debt is serviced.
The monthly break-even point is reached in month three, provided you hit the initial membership and retail sales targets. The primary driver for reaching this point is membership fee volume, which is forecasted to start at $700,000 in the first year. If labor costs for your attendants and technicians stay on plan, the high average ticket from premium washes will accelerate your path to covering fixed costs.
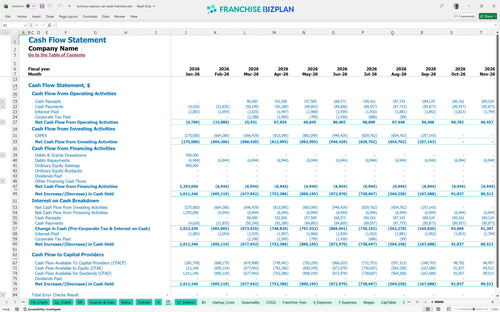
The lowest cash point is projected at -$4.258 million in September 2026, reflecting the heavy timing of equipment and construction payments. You need to ensure your financing package covers this trough to avoid liquidity issues during the final stages of the build-out. To be fair, the ramp-up is fast, but the initial cash burn is intense due to the specialized nature of the facility.
The model allows you to toggle between scenarios to see how a 10% drop in membership fees impacts your year-one margin. In a high-growth scenario, hitting $549,000 in fleet contracts by year five significantly boosts the IRR and shortens the payback window. Still, the low case highlights that even with slower growth, the high EBITDA margins of the automated model provide a decent buffer against rising labor costs.
Finance: update unit break-even and payback model by Friday
This car wash franchise unit financial model is built in Excel with fully editable assumptions, allowing you to swap out local variables without breaking the logic. You can adjust the car wash business plan drivers like membership pricing or chemical costs to see how they impact your bottom line in real-time. It is a flexible franchise financial model designed to handle everything from a single location to a small multi-unit portfolio.

Plan your long-term growth with a detailed 5-year outlook that tracks revenue, operational expenses, and cash flow. This car wash franchise profit margin analysis helps you visualize the ramp-up phase, starting from $1.775 million in year one and scaling to over $4 million by year five. Having a clear EBITDA analysis for the next 60 months is essential for securing financing and setting performance targets.

Managing franchise royalty fees and brand obligations is baked directly into the model to ensure you see the true net cash flow. We include the $50,000 initial fee plus the ongoing 4% royalty and 1% marketing fund contributions so there are no surprises in your operational expenses. This allows you to track how these top-line deductions affect your store-level margin as volume increases.

Our break-even analysis identifies exactly when your unit stops burning cash and starts generating a return. You can map out the total investment requirements for car wash franchise operations, including heavy equipment and site prep, to determine the daily wash volume needed to cover fixed costs. This section is vital for understanding your margin of safety during the first year of trading.

The model includes researched benchmarks for labor, utilities, and chemicals to help you sanity-check your projections against industry standards. If your chemical costs exceed the 4.5% starting benchmark, you'll know to investigate your equipment calibration or vendor pricing. It serves as a built-in franchise unit financial forecasting guide to keep your assumptions grounded in reality.


Simply purchase and download the financial model template, then access it instantly using Microsoft Excel or Google Sheets. No installation or technical expertise required-just open and start working.

Enter your business-specific numbers, including revenue projections, costs, and investment details. The pre-built formulas will automatically calculate financial insights, saving you time and effort.

Leverage the investor-ready format to confidently showcase your financial projections to banks, franchise representatives, or investors. Impress stakeholders with clear, data-driven insights and professional reports.

Leverage the investor-ready format to confidently present your projections to banks, franchise representatives, or investors.