
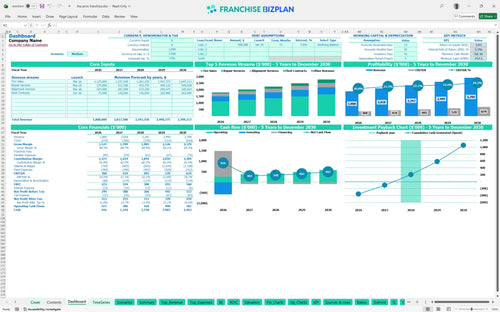
All-in-one Dashboard
Core inputs and core outputs


This comprehensive tool provides everything you need to forecast revenue, manage expenses, and analyze the long-term viability of your automotive service location.
Core inputs and core outputs
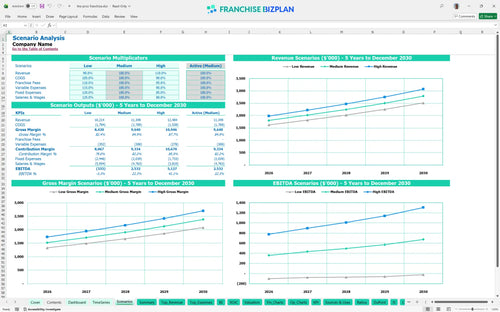
Three scenario analysis
Presentation ready
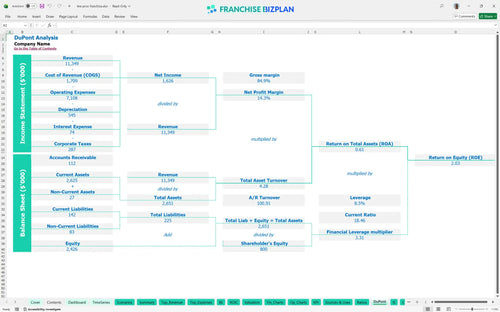
DuPont analysis
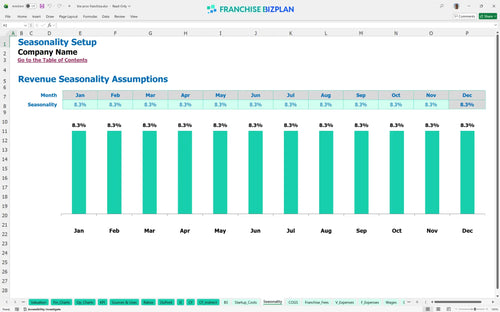
Researched revenue assumptions
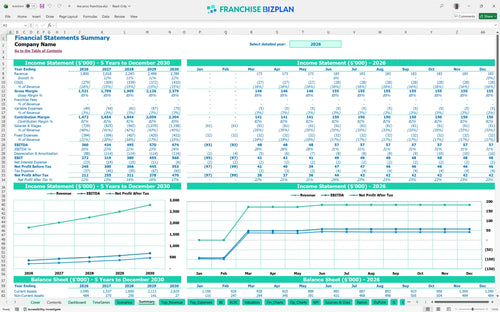
Lender-friendly financial outputs
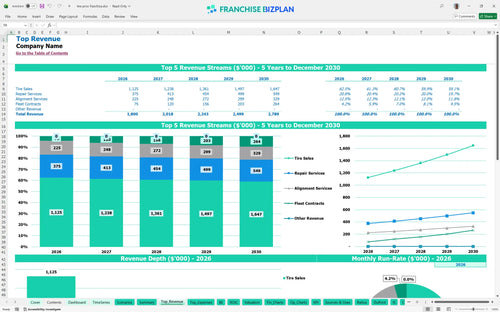
Revenue stream detailed view
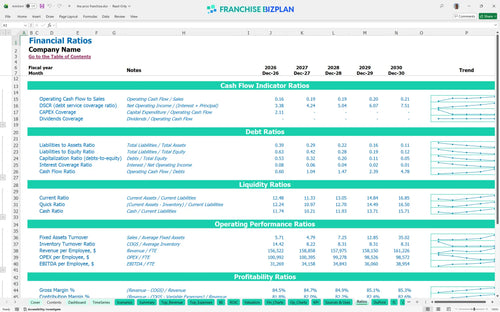
Performance metrics benchmark
We built this franchise unit financial model using our own research to help you evaluate the automotive service center revenue model. Key assumptions like the $1.8M year-one revenue and $360,000 EBITDA are pre-populated with researched data and are fully editable. It defintely covers everything from tire sales to concierge fuel costs so you can see the real numbers before signing.
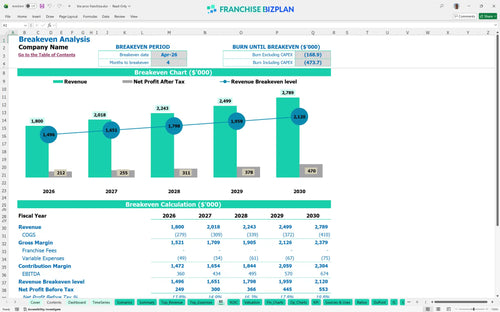
This tire shop financial projection shows the unit hitting breakeven by April 2026, just four months after launch. We calculate this by stacking your $1.1M in projected year-one tire and repair sales against fixed costs like the $20,000 monthly rent and $95,000 general manager salary. Honestly, the speed to profit depends on how fast you ramp up those high-margin fleet contracts.
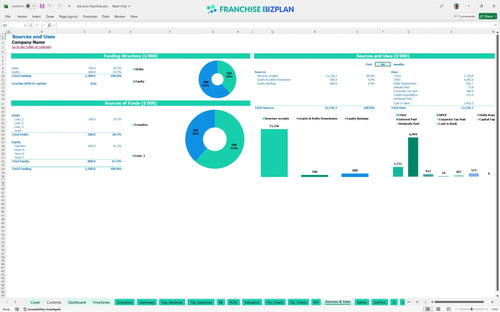
To understand how to calculate startup costs for a tire franchise, you have to look at the $572,000 total CAPEX. This includes $220,000 for leasehold improvements and $80,000 for automotive lifts. Your startup capital requirements also need to cover the initial $7,000 franchise fee and showroom fitout to meet the brand standards for affluent customers.
Analyzing ROI for a new franchise unit reveals a 5.29% IRR and a 3-year payback period. With a Year 5 EBITDA projected at $674,000, the long-term automotive franchise profit margin analysis looks stable. Still, your actual return depends on maintaining that 13.5% COGS for parts and tires while scaling your technician count from 4 to 6 over five years.
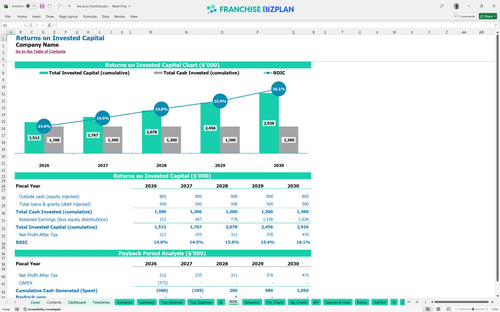
The franchise unit financial forecasting tool identifies the monthly break-even point occurring in month four. The biggest weight on your margin is the $20,000 rent and the $361,000 total annual spend on technicians and master techs. If you cannot hit the service volume early, that fixed overhead gets heavy fast, so throughput in the bays is your primary driver.
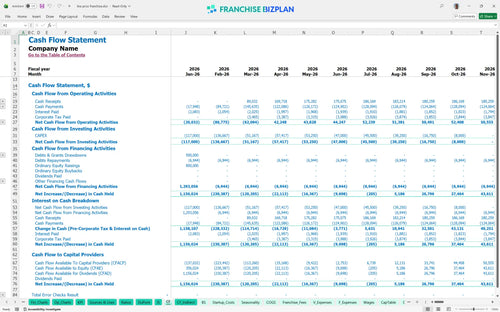
Your lowest cash point hits $757,000 in July 2026, which serves as your critical runway marker during the ramp-up phase. This startup cost spreadsheet for auto repair franchises suggests keeping a buffer because this financial model for tire and auto repair business shows that equipment maintenance can spike unexpectedly. Plus, you need to manage the $35,000 tool inventory spend carefully to protect liquidity.
Estimating profitability for a new tire shop requires looking at how a 10% dip in revenue kills your year-one $360k EBITDA. These financial projections for independent franchise owners compare Low vs High scenarios to show how pricing shifts impact your 5.29% IRR. Here's the quick math: a 5% shift in labor efficiency changes your peak cash need by thousands of dollars.
This franchise financial model template is built in Excel with pre-filled formulas that you can adjust on the fly. As an Excel financial template for automotive service franchise owners, it lets you tweak the operating expense forecast to match your specific territory and local labor market. You can modify everything from service bay throughput to individual technician wages to see how small changes impact your bottom line.

Long-term planning is the difference between a job and a business, and this franchise business plan template provides a clear 60-month roadmap. It delivers a deep profitability analysis by projecting revenue growth from $1.8M in year one to over $2.7M by year five. You get a full view of your balance sheet and cash flow to ensure you can fund future equipment upgrades or additional bays.

This model tracks the franchise royalty fee structure and marketing fund contributions to show their impact on your store-level margin. Even with the 0% royalty rate currently in the research data, the model allows you to stress-test future fee increases. It captures the $7,000 initial fee and ongoing brand obligations so you know exactly what stays in your pocket after the franchisor gets paid.

Planning your automotive franchise startup costs requires a clear view of when you will stop burning cash. This model helps you learn how to create a franchise budget for a new location by calculating the exact sales volume needed to cover your $20,000 monthly rent and staff wages. You will see the precise moment your tire and repair volume crosses the line into monthly profitability.

The franchise unit economics spreadsheet includes benchmarks for labor and occupancy to help you stay on track. If your rent exceeds the $20,000 baseline or labor drifts above planned FTE counts, you will see the impact on your $360,000 year-one EBITDA immediately. These benchmarks act as a sanity check to ensure your tire shop stays competitive with industry standard margins.


Simply purchase and download the financial model template, then access it instantly using Microsoft Excel or Google Sheets. No installation or technical expertise required-just open and start working.

Enter your business-specific numbers, including revenue projections, costs, and investment details. The pre-built formulas will automatically calculate financial insights, saving you time and effort.

Leverage the investor-ready format to confidently showcase your financial projections to banks, franchise representatives, or investors. Impress stakeholders with clear, data-driven insights and professional reports.

Leverage the investor-ready format to confidently present your projections to banks, franchise representatives, or investors.