
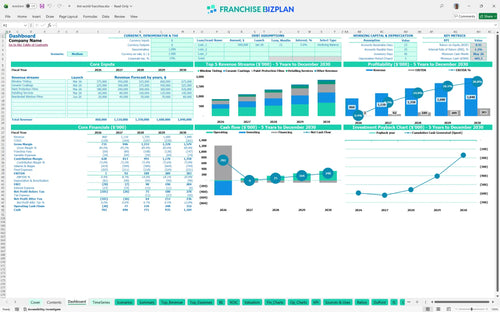
All-in-one Dashboard
Core inputs and core outputs


This franchise unit financial model template provides a complete engine room for your business plan, covering everything from initial CAPEX to 5-year EBITDA and cash flow projections.
Core inputs and core outputs
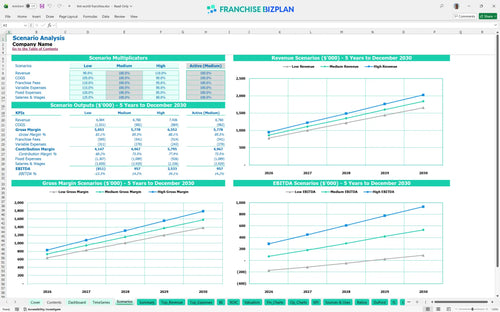
Three scenario analysis
Presentation ready
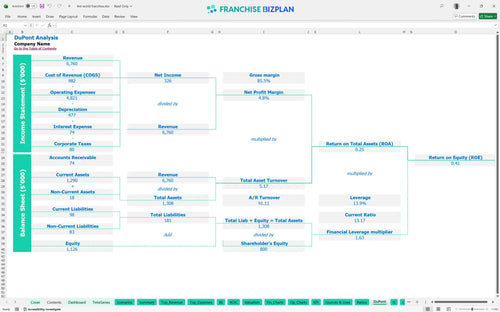
DuPont analysis
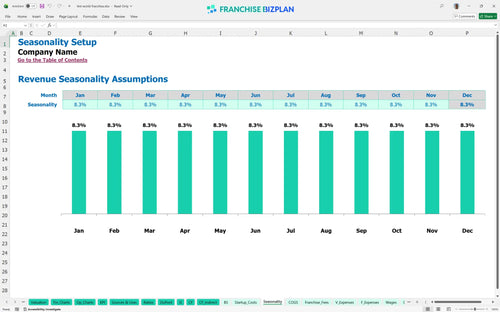
Researched revenue assumptions
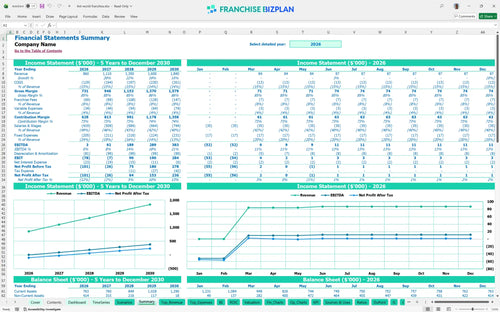
Lender-friendly financial outputs
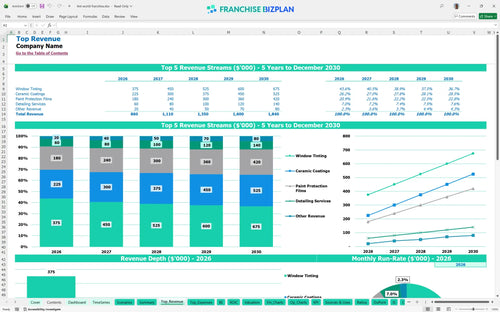
Revenue stream detailed view
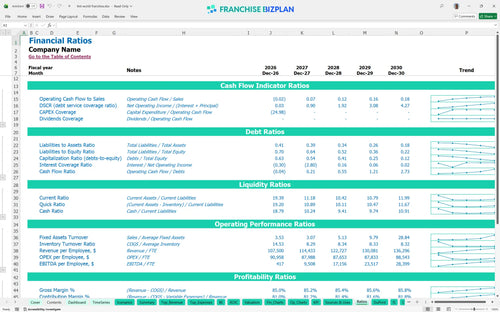
Performance metrics benchmark
We built this franchise unit financial model using our own research into the automotive styling and heat protection market. Key assumptions, including the $860,000 Year 1 revenue target and the 6% royalty structure, are pre-populated with researched data but remain fully editable for your specific location. Analyzing recurring revenue in auto service franchises becomes much simpler when you can see the path from a $3,000 Year 1 EBITDA to a $383,000 Year 5 profit. The data doesn't lie, even if it's a bit sobering at first.
This unit hits a razor-thin $3,000 EBITDA in year one, effectively acting as a break-even year while you ramp up. Estimating profitability for car detailing franchise operations shows a significant jump to $92,000 in year two as your technicians become more efficient with film and coatings. Year one is about survival; year five is about wealth.
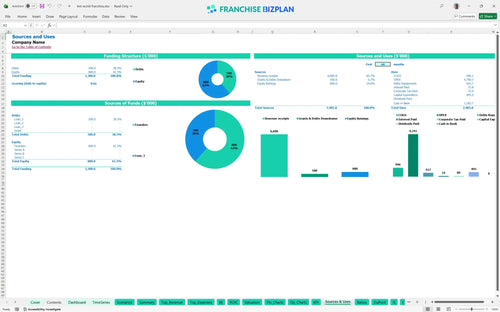
You need nearly $495,000 in total capital expenditure forecasting to get the doors open and the plotters running. This total includes the $49,950 franchise fee, $180,000 for leasehold improvements, and $60,000 for paint protection film equipment. Honestly, you should keep a healthy cash buffer for the first few months of payroll. Cash is king, but equipment is what earns the cash.
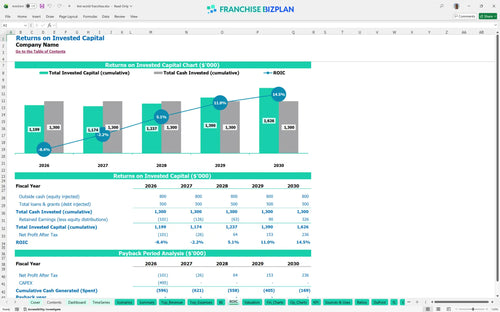
The model projects an Internal Rate of Return (IRR) of 1.17% and a 0.41 Return on Equity (ROE) based on the current growth trajectory. While the full payback of your initial investment occurs after year five, the unit generates a healthy $383,000 in annual EBITDA by that point. A 1.17% IRR means you are playing a long, steady game here.
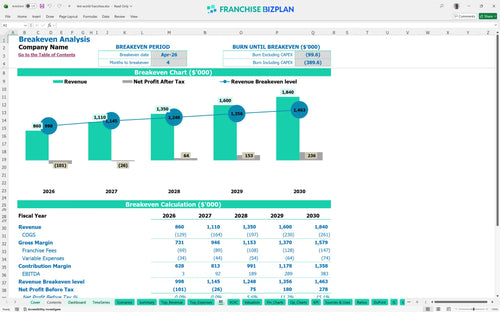
Breakeven occurs in April 2026, just four months after your initial launch, provided you hit your early volume targets. You need to cover $17,100 in monthly fixed franchise operating expenses, including $12,000 for a prime location lease. Speed to break-even is the only metric that matters in the first 120 days.
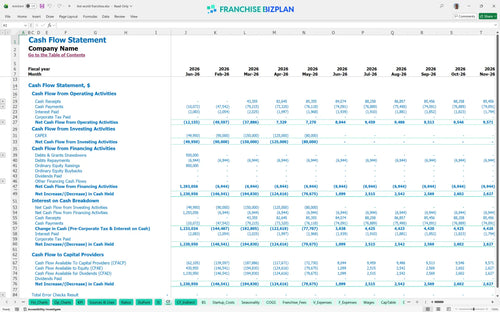
Your lowest cash point is $685,000 in May 2026, so you defintely need to watch your spending during the build-out phase. This model suggests you have enough runway to handle the ramp-up, but any delay in your March 2026 launch will pressure your working capital. Running out of cash is the only way to truly fail.
The difference between a medium and high scenario often comes down to your average ticket and local marketing execution. In a high-performance case, hitting $1.8M in revenue earlier significantly improves your Year 1 margin and shortens the long-term payback period. Hope is not a strategy, but a high-case scenario is a goal.
Finance: update unit break-even and payback model by Friday.
This franchise financial model template is built in Excel to give you total control over your projections. Every cell is a lever you can pull to see how your bottom line reacts, from adjusting film waste percentages to changing your local labor rates. It functions as a comprehensive financial model template for window tinting business owners who need to move beyond guesswork and into data-driven planning. Every 1-point margin leak matters fast in a single-unit model, so we made sure you can edit every assumption.

Mapping out a five-year horizon is essential for understanding how an automotive styling business scales from a $860,000 start to a $1.84M mature unit. This franchise business plan Excel tool tracks your revenue, cash flow, and tax obligations to ensure you aren't surprised by growth-related cash crunches. Five years is a lifetime in the car business, but you need the map anyway to secure financing or plan your next territory. It also handles multi-unit franchise accounting logic if you decide to expand beyond your first shop.

Operating within a system means accounting for a 6% royalty and a 2% brand marketing fund right off the top. This automotive service franchise investment model bakes these costs into your monthly cash flow so you see exactly what remains for local overhead and owner draws. At $860,000 in annual sales, that 8% total means $68,800 goes to the franchisor before you pay a single technician. The franchisor gets paid first, so you better know what's left for you.

Knowing how to calculate startup costs for an automotive franchise is the first step to avoiding a mid-build-out disaster. This model aggregates your $49,950 franchise fee with $180,000 in leasehold improvements and specialized gear like film plotters and ceramic coating tools. We also include a franchise investment feasibility study spreadsheet to determine the exact day your sales cover your $17,100 in monthly fixed costs. Knowing your break-even is the difference between sleeping and staring at the ceiling.

We have integrated real-world automotive styling benchmarks to help you perform a realistic franchise unit profitability analysis. If your labor costs for technicians and concierge drivers drift too far from the 30% range, the model flags it so you can adjust your staffing levels or pricing. This franchise unit financial forecasting guide ensures your rent-to-revenue ratios and material costs stay within healthy industry norms. Don't guess on labor when the industry already has the answers.


Simply purchase and download the financial model template, then access it instantly using Microsoft Excel or Google Sheets. No installation or technical expertise required-just open and start working.

Enter your business-specific numbers, including revenue projections, costs, and investment details. The pre-built formulas will automatically calculate financial insights, saving you time and effort.

Leverage the investor-ready format to confidently showcase your financial projections to banks, franchise representatives, or investors. Impress stakeholders with clear, data-driven insights and professional reports.

Leverage the investor-ready format to confidently present your projections to banks, franchise representatives, or investors.