
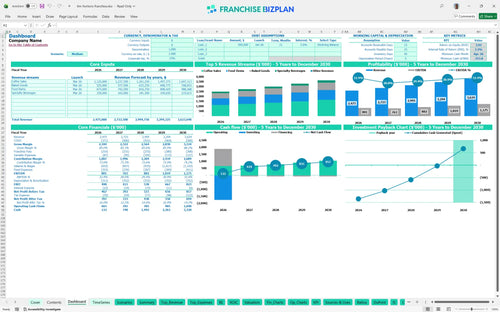
All-in-one Dashboard
Core inputs and core outputs


This tool provides a complete roadmap for coffee franchise ownership, covering everything from initial build-out costs to five-year EBITDA growth.
Core inputs and core outputs
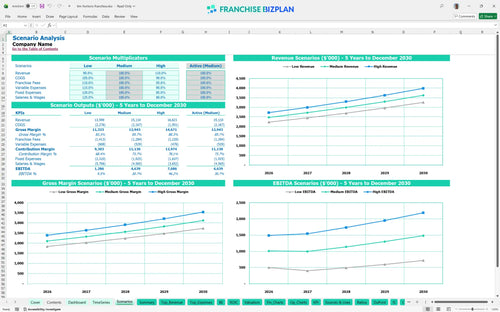
Three scenario analysis
Presentation ready
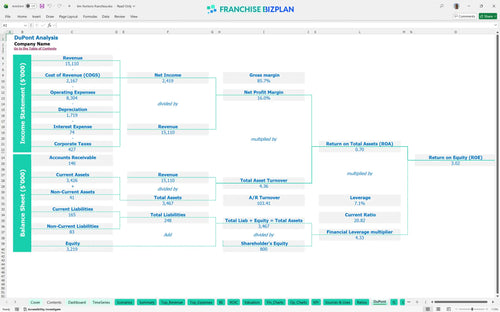
DuPont analysis
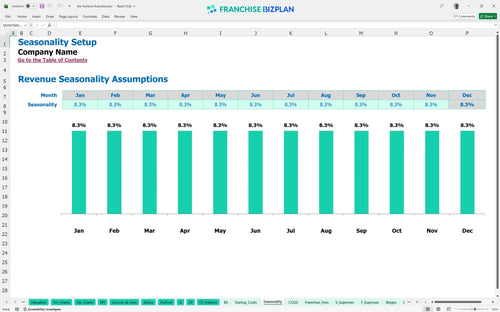
Researched revenue assumptions
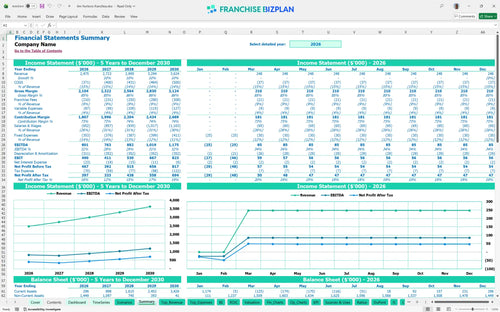
Lender-friendly financial outputs
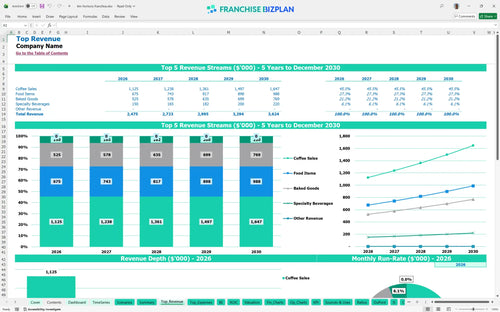
Revenue stream detailed view
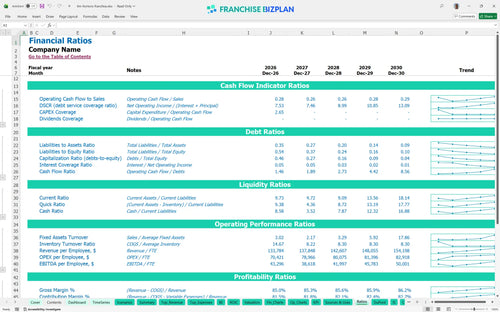
Performance metrics benchmark
We built this model to help you master understanding franchise unit economics and profit margins for a high-volume coffee concept. Key assumptions like the $50,000 franchise fee and $2,475,000 year-one revenue are pre-populated based on real-world QSR data and are fully editable to fit your territory. This coffee shop franchise business plan tool ensures you aren't flying blind when you sign that multi-year lease.
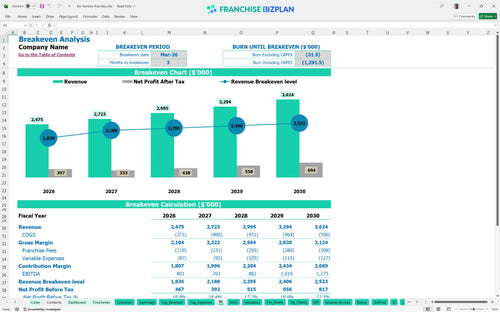
This unit is projected to reach its break-even date in March 2026, just three months after launching. With a year-one EBITDA of $801,000, the business defintely generates strong cash flow early, provided you hit the $750,000 coffee sales target. Profitability is driven by maintaining a tight 13.5% cost on ingredients and managing a large crew efficiently.
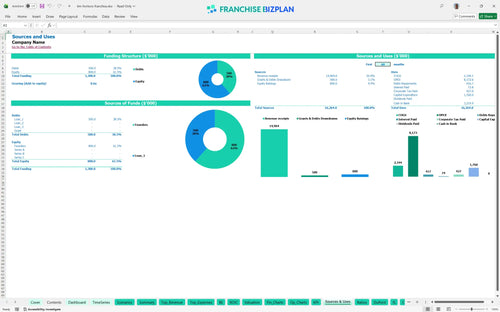
You will need approximately $1,760,000 in total capital to cover the initial build-out and fees. This includes the $50,000 franchise fee and significant leasehold improvements of $850,000 to meet brand standards. Knowing how to calculate startup costs for a coffee franchise is vital since equipment and drive-thru infrastructure alone exceed $600,000.
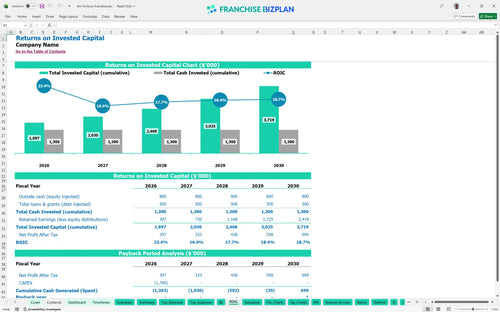
The restaurant franchise return on investment analysis shows a 5-year payback period with an internal rate of return (IRR) of 3.21%. While the ROE is 3.02%, the long-term value lies in the scaling revenue, which hits $3,624,000 by year five. This franchise ROI analysis suggests a stable, though capital-intensive, investment for a patient operator.
The unit hits break-even in month 3, but the real test is covering the $22,000 monthly rent and $31,200 crew member salaries. Estimating franchise revenue and operating expenses shows that volume is the primary driver; you need consistent traffic across coffee and food segments to stay ahead of fixed costs. High-speed throughput is the only way to protect your margins.
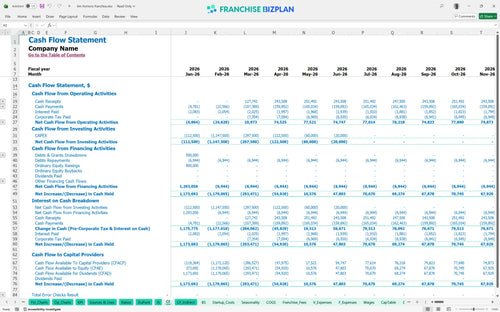
The lowest cash point occurs in April 2026 at -$354,000, meaning you need a solid working capital buffer beyond your initial CAPEX. This coffee franchise business financial planning spreadsheet highlights that the gap between opening and full ramp-up can be tight. You must have enough liquidity to survive the first 120 days of operations.
Financial modeling for multi-lane drive-thru restaurant units shows that a 10% drop in traffic can delay your payback period by over a year. Conversely, hitting the high-growth scenario moves EBITDA from $801,000 toward the $1.1M mark much faster. Financial forecasting for quick service restaurant expansion requires testing these 'what-if' situations to ensure the model survives a recession.
This franchise financial model template is built in Excel to give you total control over your projections. You can adjust every variable from hourly wages to the cost of coffee beans, ensuring the numbers reflect your specific market rather than just a national average. Using an Excel template for franchise unit profitability analysis allows you to swap out pre-filled data for your actual lease terms and local tax rates. Excel is the gold standard for a reason.

Success in the QSR space requires looking past the grand opening to see how the business matures. This model provides detailed QSR franchise financial projections that track your growth from year one through year five, including automated operating expense forecasting. You can see how a 10% annual revenue climb, like the jump from $2,475,000 to $2,723,000 in year two, impacts your bottom line. Five years is a lifetime in the coffee business.

The model simplifies the royalty and advertising fee structure by automatically calculating payments based on your gross sales. With a 4.5% royalty and a 4.0% marketing fund contribution, you need to know exactly how much cash leaves the store before you pay your own bills. This tool acts as a franchise disclosure document financial data analysis partner, helping you see the impact of these fixed percentages on your monthly liquidity. Royalties are a tax on the top line, not the bottom.

Planning your entry requires a precise franchise unit investment calculator to avoid mid-construction cash crunches. This model helps with preparing a financial feasibility study for a new franchise by mapping out every dollar spent before the first customer walks in. You will see exactly when the unit covers its $22,000 monthly rent and moves into the black. Knowing your floor is more important than knowing your ceiling.

This quick service restaurant financial model uses researched data to set realistic baselines for labor and COGS (cost of goods sold). If your food and beverage ingredients are projected at 13.5%, you can instantly compare that to industry norms to see if your waste management is on point. It helps you identify margin leaks in your unit economics before they become permanent problems. Don't guess when you can benchmark.


Simply purchase and download the financial model template, then access it instantly using Microsoft Excel or Google Sheets. No installation or technical expertise required-just open and start working.

Enter your business-specific numbers, including revenue projections, costs, and investment details. The pre-built formulas will automatically calculate financial insights, saving you time and effort.

Leverage the investor-ready format to confidently showcase your financial projections to banks, franchise representatives, or investors. Impress stakeholders with clear, data-driven insights and professional reports.

Leverage the investor-ready format to confidently present your projections to banks, franchise representatives, or investors.