


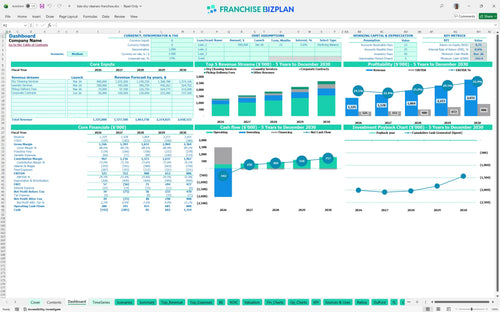
All-in-one Dashboard
Core inputs and core outputs



This revenue projection model for automated dry cleaning kiosk operations includes a complete 5-year outlook with integrated CAPEX, payroll, and franchise-specific fee tracking.
Core inputs and core outputs
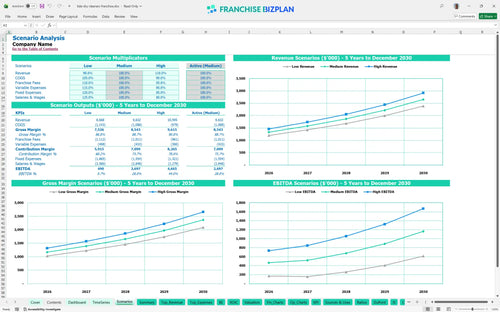
Three scenario analysis
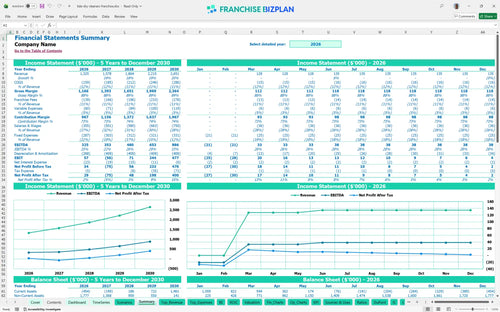
Presentation ready
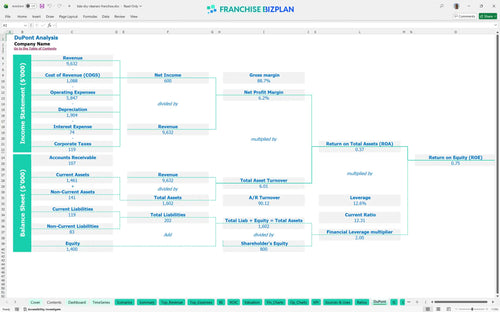
DuPont analysis
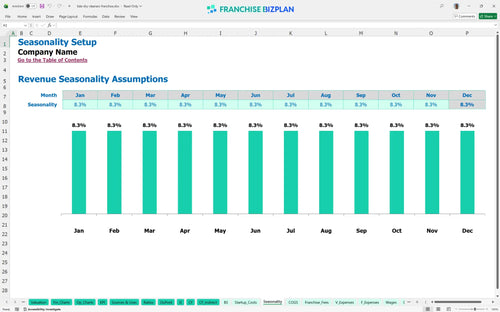
Researched revenue assumptions
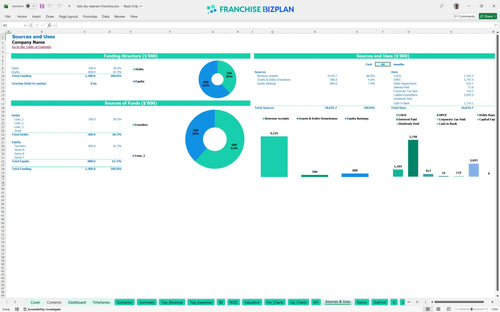
Lender-friendly financial outputs
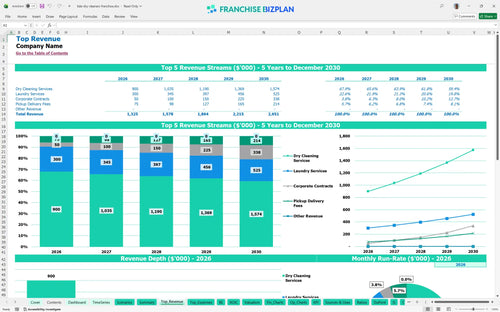
Revenue stream detailed view
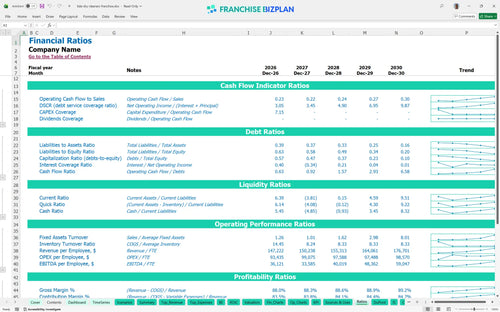
Performance metrics benchmark
We built this financial model for eco-friendly dry cleaning business owners using detailed research into premium garment care operations. Key assumptions like the $18,000 monthly rent, 6.5% royalty, and $1.3M year-one revenue target are pre-populated and fully editable. This tool gives you a data-driven starting point for evaluating a high-capacity drive-thru and kiosk-based model.
The unit hits the ground running with a projected EBITDA of $325,000 in its first full year. Profitability scales significantly as revenue grows, reaching $886,000 by year five as corporate contracts and delivery fees mature. Here's the quick math: your store-level margin benefits greatly from the 9.3% chemical supply efficiency target in later years.
How to calculate startup costs for a dry cleaning franchise starts with the $20,000 initial fee and ends with a total investment exceeding $2 million. This startup budget template for retail garment care business owners includes $800,000 for leasehold improvements and $400,000 for specialized cleaning equipment. You also need to budget for the $200,000 automated kiosk system.
The dry cleaning franchise ROI calculator shows an internal rate of return (IRR) of 62% and a return on equity (ROE) of 0.75. While the upfront capital is high, the aggressive revenue ramp-up supports strong long-term yields. Still, the payback period extends beyond year five due to the significant initial $2M+ cash outlay.
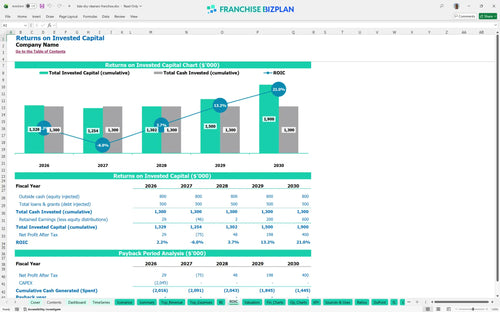
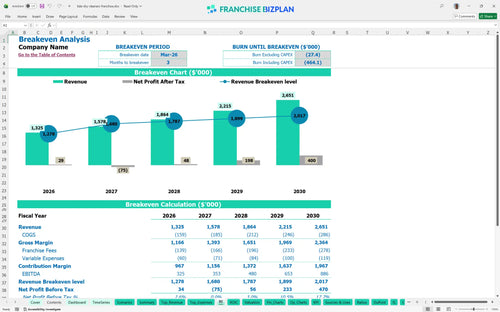
The unit reaches its break-even date in March 2026, just three months after the launch of services. This rapid break-even is driven by the high year-one revenue target of $1.32 million, which must cover the $18,000 monthly rent and 10.5% chemical costs. To be fair, hitting this target requires immediate traction in the high-end residential segment.
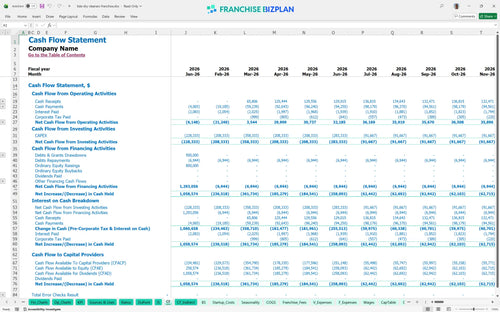
The lowest cash point occurs in December 2026, with a minimum cash balance of -$542,000 during the ramp-up phase. You need a significant working capital buffer to navigate the period between the $800,000 build-out and the point where cash flow from operations fully covers the debt and overhead. Managing the timing of the $150,000 delivery vehicle purchase is critical.
A franchise financial feasibility study template shows that your year-one margin is highly sensitive to labor and chemical costs. In a high-case scenario, maximizing the $337,500 corporate contract potential by year five significantly boosts the IRR. If opening takes 90+ days longer than planned, the cash buffer needs to increase to handle the $18,000 monthly rent burn.
Finance: update unit break-even and payback model by Friday.
This dry cleaning franchise financial model is fully customizable in Excel, allowing you to adjust everything from local labor rates to specific solvent costs. The pre-filled formulas and editable assumptions make it easy to adapt the plan to your specific Scottsdale or high-end territory. You can defintely swap out the default values to see how different rent or utility scenarios impact your bottom line.

Plan for long-term growth with a dry cleaning business financial projection that tracks your path from opening day through year five. The model forecasts revenue climbing from $1.32 million in the first year to over $2.6 million as you mature. It provides a clear view of how your laundry franchise business plan scales as you add corporate contracts and delivery routes.

The model accurately captures your specific financial obligations, including the 6.5% royalty and 4% marketing fund contribution. By analyzing franchise royalty and marketing fees in Excel, you can see exactly how much cash leaves the unit before you pay your local bills. This helps you understand the real-world economics of a premium garment care operation.

Estimating operating expenses for a laundry franchise starts with a clear view of the $2 million-plus initial investment. This franchise startup cost template helps you map out the $800,000 build-out and $400,000 equipment package. You will know exactly what sales volume is required to cover your $18,000 monthly rent and fixed overhead.

We have incorporated dry cleaning industry benchmarks to help you sanity-check your unit economics modeling. The template includes standard ranges for cleaning chemicals, which start at 10.5% of sales in year one and improve as you gain efficiency. This ensures your franchise unit profit and loss template stays grounded in operational reality.


Simply purchase and download the financial model template, then access it instantly using Microsoft Excel or Google Sheets. No installation or technical expertise required-just open and start working.

Enter your business-specific numbers, including revenue projections, costs, and investment details. The pre-built formulas will automatically calculate financial insights, saving you time and effort.

Leverage the investor-ready format to confidently showcase your financial projections to banks, franchise representatives, or investors. Impress stakeholders with clear, data-driven insights and professional reports.

Leverage the investor-ready format to confidently present your projections to banks, franchise representatives, or investors.