


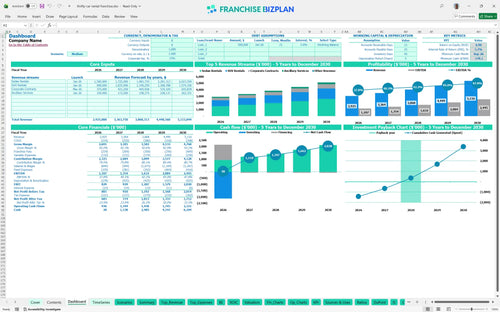
All-in-one Dashboard
Core inputs and core outputs



This franchise unit financial model provides a complete roadmap for car rental profitability, covering fleet acquisition, 8% royalty structures, and 5-year cash flow forecasting.
Core inputs and core outputs
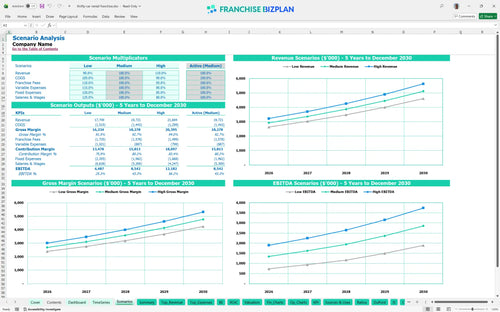
Three scenario analysis
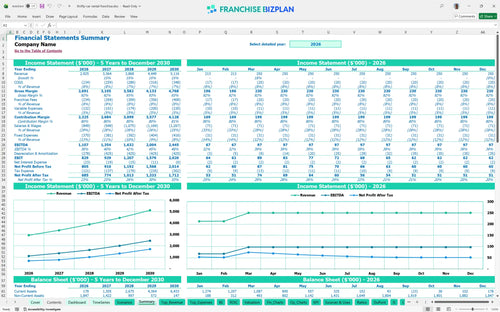
Presentation ready
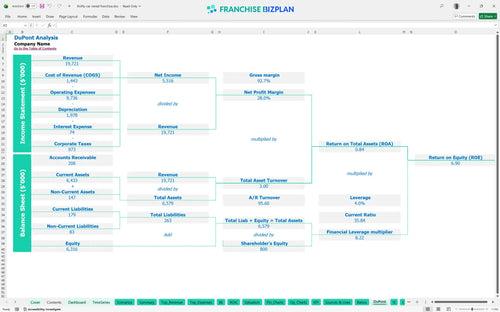
DuPont analysis
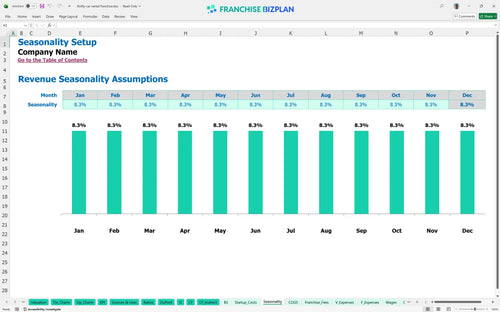
Researched revenue assumptions
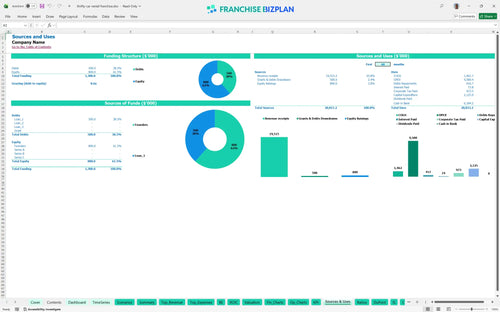
Lender-friendly financial outputs
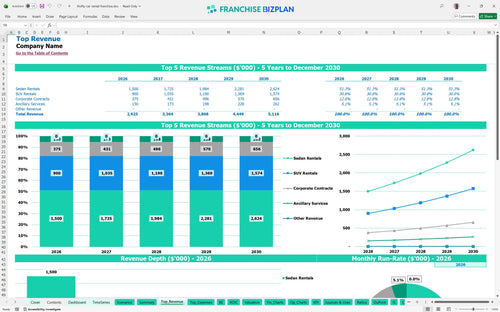
Revenue stream detailed view
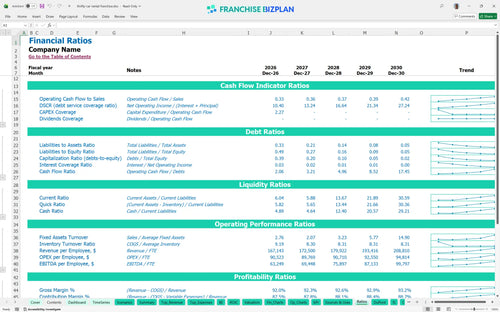
Performance metrics benchmark
We built this franchise unit financial model using detailed research into the car rental sector to ensure your franchise unit profitability analysis is accurate. Key assumptions, including the $2,925,000 Year 1 revenue target and the $800,000 initial fleet purchase, are pre-populated and fully editable to match your specific territory.
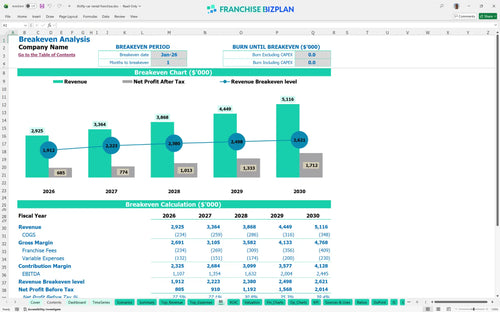
The unit hits the ground running with an EBITDA of $1,107,000 in its first year, reaching operational break-even in Jan-2026. Profitability scales as revenue grows by roughly 15% annually, but you must watch the 8% royalty drag on your net margin.
You will need approximately $2,125,000 to launch this franchise unit in the US, covering everything from the $125,000 franchise fee to the $800,000 initial fleet. The model also accounts for $400,000 in leasehold improvements and a $300,000 building renovation to meet brand standards.
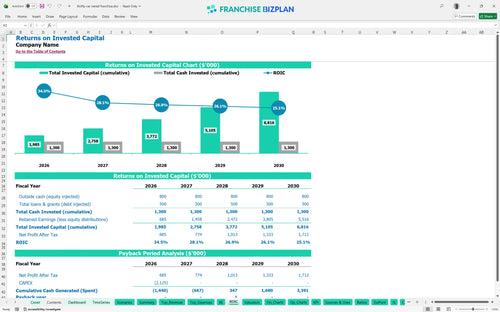
Investors can expect an Internal Rate of Return (IRR) of 5.75% and a Return on Equity (ROE) of 6.9%. While the initial capital outlay is high, the 3-year payback period is reasonable for a heavy asset business like vehicle rentals.
The model shows a break-even date of Jan-2026, meaning the unit covers its fixed costs in the first month of operation. This is defintely dependent on hitting the $1,000,000 sedan rental target and managing the $15,000 monthly facility rent.
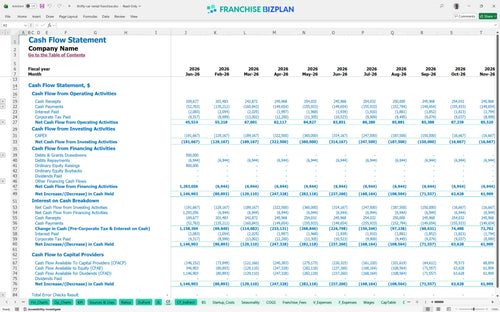
The lowest cash point occurs in Sep-2026 at -$178,000, primarily due to the timing of fleet acquisition and ramp-up costs. You should maintain a cash buffer to handle this dip, especially if leasehold improvements take longer than the planned six months.
In a High scenario, increasing corporate contracts beyond $250,000 can significantly boost Year 1 EBITDA. Conversely, a Low scenario with higher fuel costs (above 5%) or lower SUV demand would stretch the payback period past the 3-year mark.
Use this financial forecasting for franchise unit operations to validate your territory's demand and secure financing. Focus on the fleet acquisition cost analysis to ensure your initial $800,000 investment aligns with local sedan and SUV pricing.
Finance: update unit break-even and payback model by Friday.
This car rental franchise business model is built in Excel with fully editable assumptions, allowing you to tweak every variable from fleet size to seasonal utilization. The pre-filled formulas handle the heavy lifting, so you can focus on testing different local demand scenarios and site-specific costs without building a spreadsheet from scratch.

Plan your long-term growth with a franchise financial model template that projects five years of performance, starting with $2,925,000 in Year 1 revenue. The model tracks how scaling your fleet from sedans to SUVs impacts your bottom line as revenue climbs toward $5,116,000 by Year 5, giving you a clear view of future cash flow and balance sheet health.

Operating a franchise unit requires precise tracking of brand-specific costs like the 8% royalty fee and the initial $125,000 franchise fee. This model calculates these obligations automatically against your projected revenue streams, ensuring you understand exactly how much gross income stays in your pocket after the franchisor takes their cut.

Estimating your rental car franchise startup costs is critical, especially with a $2,125,000 initial capital requirement covering fleet and facility fit-out. The model provides a detailed break-even analysis, showing that while you hit a monthly break-even almost immediately in Jan-2026, the real goal is managing the fixed $30,800 monthly overhead for rent and insurance.

This tool uses industry-standard benchmarks to help you sanity-check your car rental business financial plan. With Year 1 labor costs for 22.5 full-time equivalents and fuel expenses starting at 5% of revenue, you can compare your store-level margins against typical franchise performance to ensure your projections are grounded in reality.


Simply purchase and download the financial model template, then access it instantly using Microsoft Excel or Google Sheets. No installation or technical expertise required-just open and start working.

Enter your business-specific numbers, including revenue projections, costs, and investment details. The pre-built formulas will automatically calculate financial insights, saving you time and effort.

Leverage the investor-ready format to confidently showcase your financial projections to banks, franchise representatives, or investors. Impress stakeholders with clear, data-driven insights and professional reports.

Leverage the investor-ready format to confidently present your projections to banks, franchise representatives, or investors.