
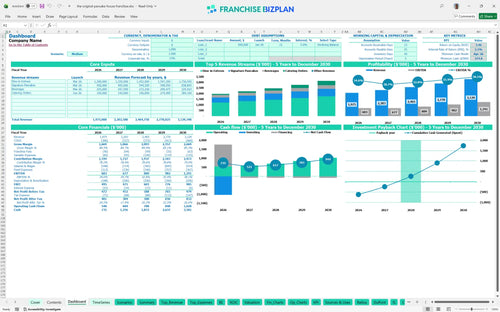
All-in-one Dashboard
Core inputs and core outputs


This restaurant franchise investment analysis excel spreadsheet provides a complete toolkit for operational expense forecasting and calculating return on investment for a food franchise.
Core inputs and core outputs
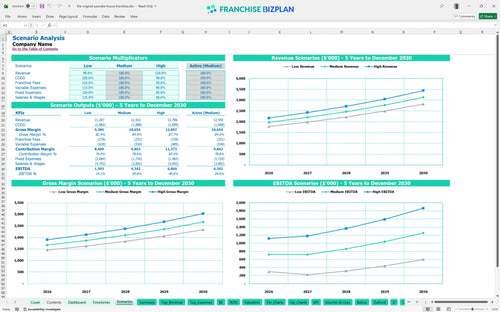
Three scenario analysis
Presentation ready
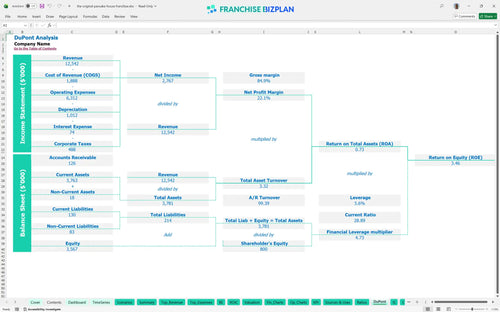
DuPont analysis
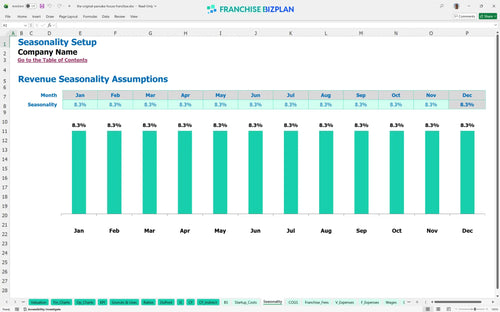
Researched revenue assumptions
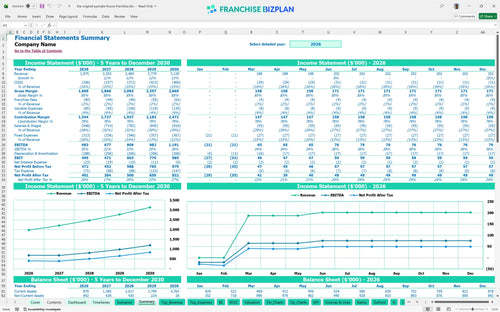
Lender-friendly financial outputs
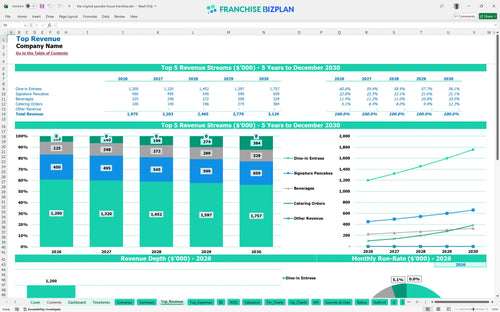
Revenue stream detailed view
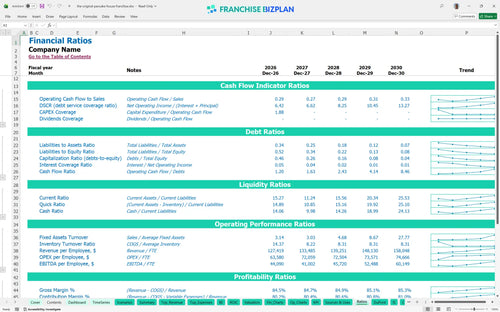
Performance metrics benchmark
We built this financial model for new restaurant franchise location planning using detailed market research and historical performance data. Key assumptions like your $1.97M Year 1 revenue, $18,000 monthly rent, and 2% royalty fees are pre-populated and fully editable to match your specific territory. This tool gives you a data-driven look at EBITDA growth, which is projected to climb from $683,000 to over $1.19M by Year 5.
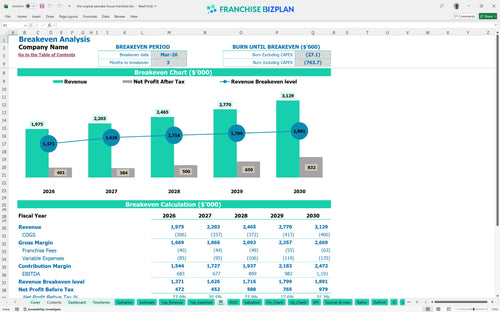
The unit reaches profitability very quickly, hitting its break-even point in March 2026, just three months after opening. With Year 1 EBITDA at $683,000, the franchise profitability analysis for restaurant operators shows a strong upward trend as catering and signature items scale. We defintely see the net profit margin improving as food costs drop from 14.5% to 13.7% over five years.
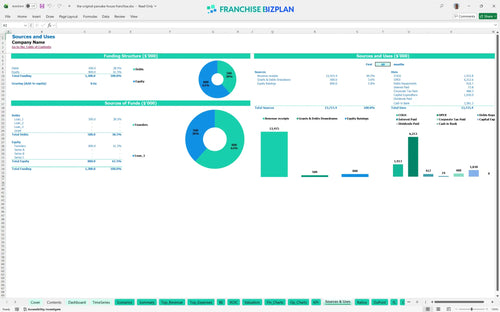
You will need approximately $1,030,000 in startup capital to cover the initial build-out and equipment, plus a $275,000 cash buffer. This covers the $60,000 franchise fee and the $450,000 needed for leasehold improvements. Knowing how to calculate startup costs for a breakfast franchise is vital so you don't run out of cash during the critical pre-opening phase.
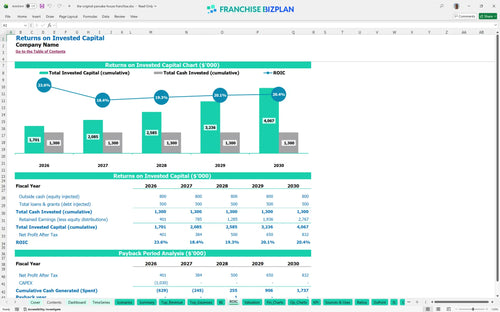
The model projects a 3-year payback period, which is a healthy timeline for a high-volume breakfast concept. Using the restaurant ROI calculator, we see an Internal Rate of Return (IRR) of 5.12% and a Return on Equity (ROE) of 3.46%. While the initial returns are steady, the real value is in the $1.19M annual EBITDA potential by Year 5.
The monthly break-even occurs in March 2026, driven by the high volume of dine-in entrees and signature pancakes. Your biggest hurdle is the $18,000 monthly rent plus $23,000 in monthly management salaries. To hit this point faster, you must maintain high table turnover during the peak morning hours when demand is densest.
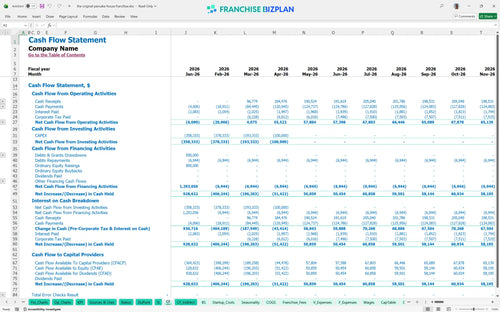
The lowest cash point is $275,000 in April 2026, shortly after the unit opens and initial capital is deployed. Estimating operating expenses for a new restaurant franchise accurately is the only way to ensure this buffer remains intact. You need enough runway to survive the first 90 days of operations before the $100,000+ monthly revenue streams fully stabilize.
Franchise unit economic modeling for restaurants shows that a 10% swing in revenue significantly impacts your Year 1 margin. In a High scenario, where catering grows faster than the projected $100,000, your peak cash need decreases and your IRR climbs. Conversely, if labor costs exceed the projected $75,000 manager salary and $40,000 cook wages, your payback period could stretch to 4+ years.
This restarant model is the definitive tool for any operator looking to move from a business plan to a profitable reality. Finance: update unit break-even and payback model by Friday.
This restaurant franchise financial model is built in Excel to give you total control over your numbers. It features pre-filled formulas and editable assumptions, so you can swap out rent, labor rates, or menu prices to see how they impact your bottom line instantly. It is the best financial template for franchise business plan development because it adapts to your specific market conditions rather than relying on generic averages.

Planning for the long term is the only way to survive in the food industry. This restaurant franchise financial projection template provides a detailed 5-year outlook, covering everything from Year 1 revenue of $1.97 million to a Year 5 target of $3.12 million. You get a clear view of how cash flow and profit evolve as your unit matures and your local reputation grows.

The model handles the heavy lifting of calculating your franchise royalty fee structure and other brand-related costs. With a 2% royalty fee baked into the monthly projections, you can see exactly how much goes to the franchisor before you pay your own bills. This ensures you understand the real economics of the franchise agreement and how it affects your store-level margin.

Using this franchise startup cost spreadsheet, you can map out every dollar needed before you flip the first pancake. From the $60,000 initial fee to the $450,000 leasehold improvements, the model tracks your total investment. It then calculates the exact sales volume you need to cover your $18,000 monthly rent and other fixed costs to reach break-even.

We have integrated restaurant unit economics and industry benchmarks to help you sanity-check your projections. You can compare your food ingredient costs-starting at 14.5%-against typical breakfast sector ranges to ensure your model is realistic. This helps you spot potential margin leaks in labor or occupancy before they become actual bank account problems.


Simply purchase and download the financial model template, then access it instantly using Microsoft Excel or Google Sheets. No installation or technical expertise required-just open and start working.

Enter your business-specific numbers, including revenue projections, costs, and investment details. The pre-built formulas will automatically calculate financial insights, saving you time and effort.

Leverage the investor-ready format to confidently showcase your financial projections to banks, franchise representatives, or investors. Impress stakeholders with clear, data-driven insights and professional reports.

Leverage the investor-ready format to confidently present your projections to banks, franchise representatives, or investors.