
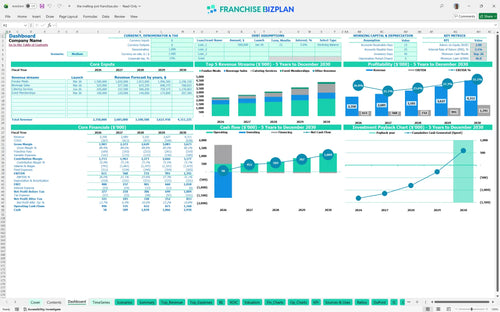
All-in-one Dashboard
Core inputs and core outputs


This restaurant franchise financial model excel template includes deep-dive tabs for CAPEX, multi-year P&L statements, and dynamic staffing calculators to ensure your unit is ready for day-one operations. It's the full stack for your pro forma.
Core inputs and core outputs
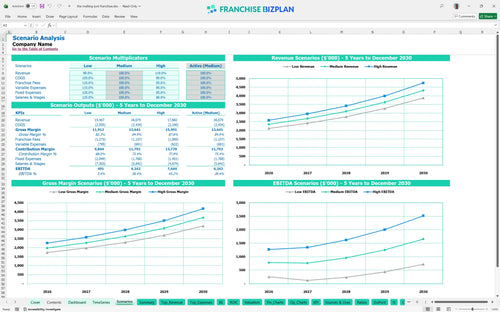
Three scenario analysis
Presentation ready
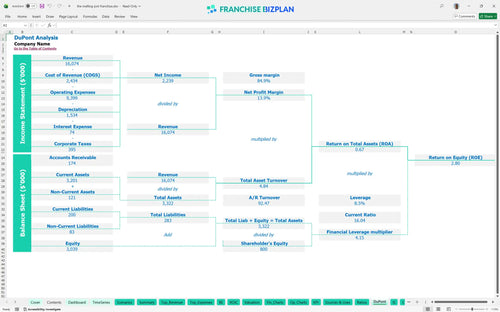
DuPont analysis
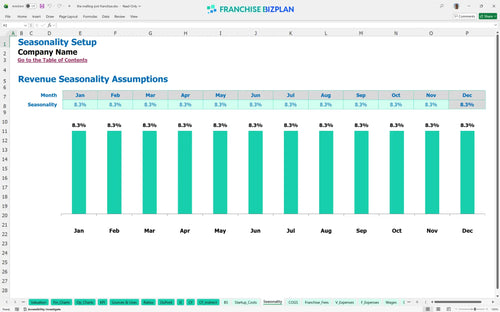
Researched revenue assumptions
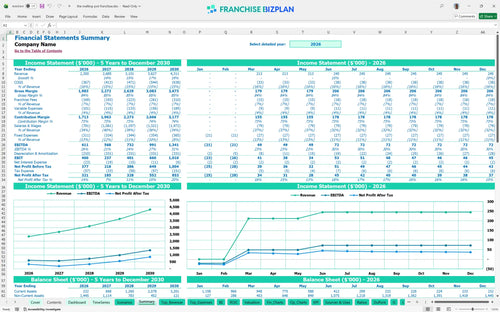
Lender-friendly financial outputs
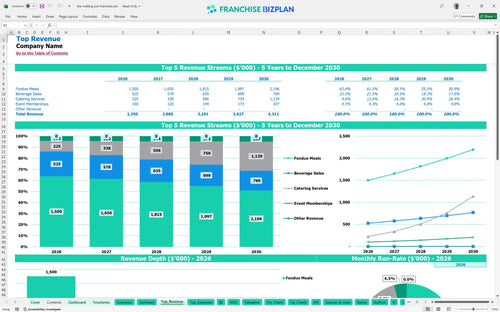
Revenue stream detailed view
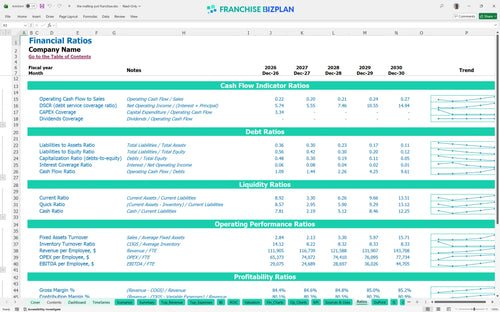
Performance metrics benchmark
We built this franchise unit financial model using our own research into the upscale experiential dining sector. Key assumptions, including the $2.35M year-one revenue target and the 5% royalty fee, are pre-populated with researched data specific to The Melting Pot Franchise franchise unit and are fully editable to reflect your local market conditions.
The unit is projected to be profitable in its first full year, generating an EBITDA of $611,000. By year five, as catering and memberships scale, net profit defintely climbs toward an annual EBITDA of $1,341,000. Margin expansion is the name of the game here.
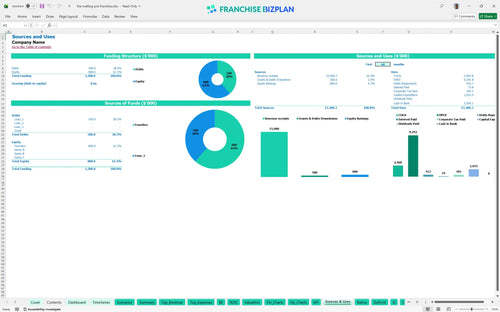
You need approximately $1,655,000 to launch this unit, which includes the $45,000 franchise fee and a significant capital expenditure budget for build-out. This restaurant franchise startup cost breakdown assumes a high-end finish in a prime location. Construction is where the budget usually dies.
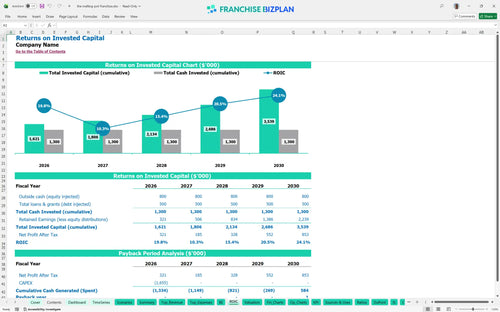
Based on the franchise investment analysis, you can expect an IRR of 3.09% and a 5-year payback period. While the initial ROI is modest, the 2.8 ROE reflects the long-term value of the asset and brand equity. Patience is a requirement for this level of CAPEX.
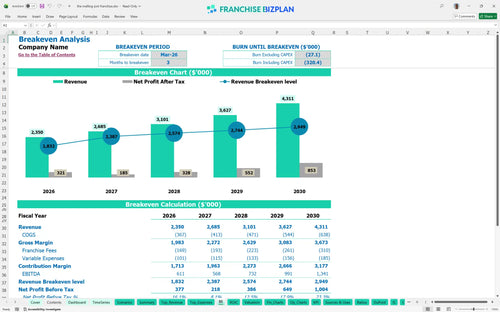
The unit hits its break-even point in March 2026, just three months after the initial launch. To reach this, you need to hit your monthly revenue targets to cover the $18,000 rent and the 5% royalty burden. Volume is your best friend for covering that rent.
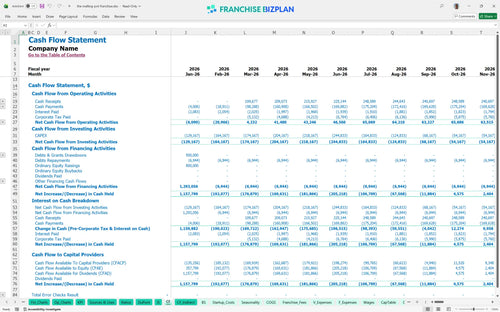
The lowest cash point is $46,000 in September 2026, suggesting a tight window during the first year of ramp-up. A financial feasibility study for restaurant franchise units shows you should maintain a small buffer to handle utility spikes or maintenance. Watch the September dip like a hawk.
Using the franchise unit financial forecasting spreadsheet, a High scenario with 10% higher revenue significantly boosts the year-1 EBITDA. Conversely, a Low scenario might delay the 5-year payback if labor costs for the 10 servers exceed projections. High cases require perfect execution on the floor.
This franchise unit financial model is a fully customizable Excel tool designed for precision. It features pre-filled formulas and editable assumptions, allowing you to adjust everything from local labor rates to specific territory pricing. Every cell is open for your own data.

Plan for the long haul with detailed projections that track your growth from a year-one revenue of $2,350,000 to over $4,311,000 by year five. This cash flow forecasting tool maps out your path to maturity, ensuring you see the impact of scaling catering and memberships. Five years is a lifetime in food, but you need a map.

Operating a branded unit means managing specific obligations like a 5% royalty and a 2.2% marketing fund contribution. This model simplifies analyzing franchise operational costs and profit margins by automating these calculations against your gross sales. Don't forget the franchisor always gets paid first.

Use this restaurant startup cost calculator to estimate your total initial investment and identify exactly when you will stop burning cash. By mapping fixed costs like the $18,000 monthly rent against variable margins, you can pinpoint the sales volume required to stay in the black. Speed to break-even is the only metric that lets you sleep.

The model incorporates best practices for restaurant franchise budget planning, using researched benchmarks for food ingredients at roughly 13.8% and packaging at 1.8%. These figures help you sanity-check your local performance against established brand standards. Benchmarks keep your ego in check.


Simply purchase and download the financial model template, then access it instantly using Microsoft Excel or Google Sheets. No installation or technical expertise required-just open and start working.

Enter your business-specific numbers, including revenue projections, costs, and investment details. The pre-built formulas will automatically calculate financial insights, saving you time and effort.

Leverage the investor-ready format to confidently showcase your financial projections to banks, franchise representatives, or investors. Impress stakeholders with clear, data-driven insights and professional reports.

Leverage the investor-ready format to confidently present your projections to banks, franchise representatives, or investors.