
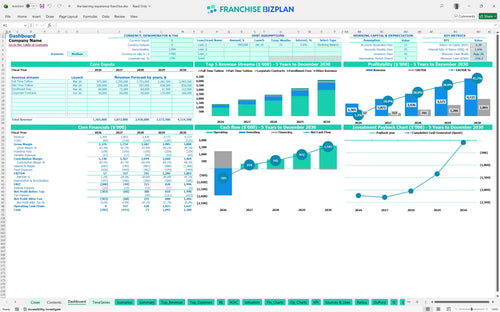
All-in-one Dashboard
Core inputs and core outputs


This franchise financial template includes a complete set of pro forma statements, a cap table, and a detailed breakdown of daycare center business financial projections.
Core inputs and core outputs
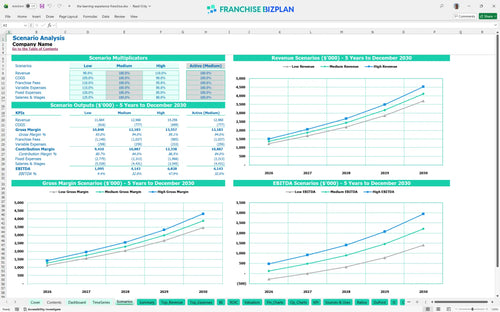
Three scenario analysis
Presentation ready
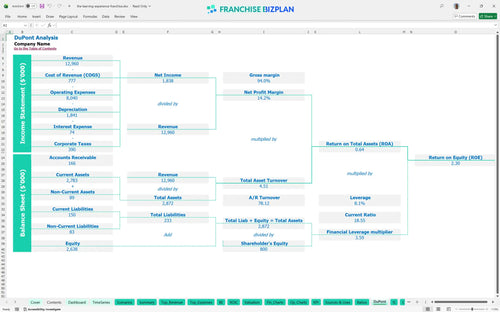
DuPont analysis
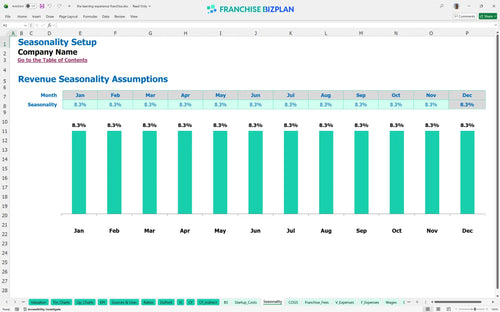
Researched revenue assumptions
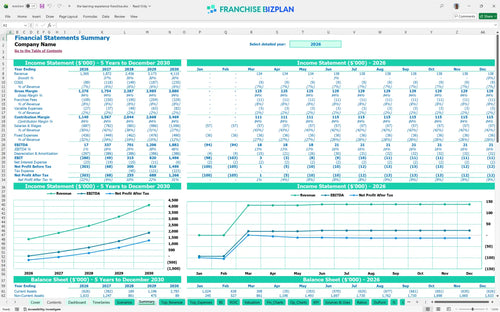
Lender-friendly financial outputs
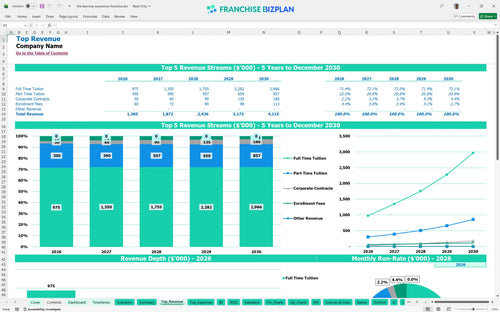
Revenue stream detailed view
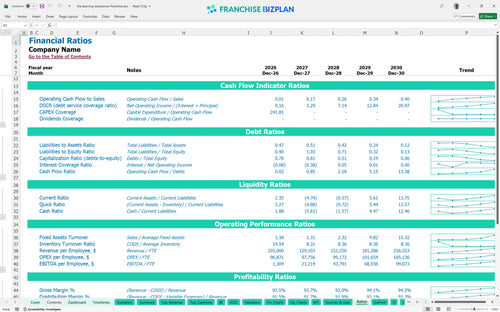
Performance metrics benchmark
We built this franchise unit economic model for childcare using our own research into the early education sector. Key assumptions like the $1,365,000 year-one revenue and the $1,930,000 total build-out are pre-populated and fully editable to match your specific site. This tool helps you see how a 7% royalty fee impacts your cash flow as you scale toward $4,115,000 in annual sales.
The unit reaches EBITDA-positive status in its first year with a projected $17,000, though profitability analysis for early childhood education franchise shows net profit takes longer to stabilize after accounting for the heavy $1.93M initial CAPEX. By year three, EBITDA climbs to $701,000 as enrollment fees and full-time tuition scale up.
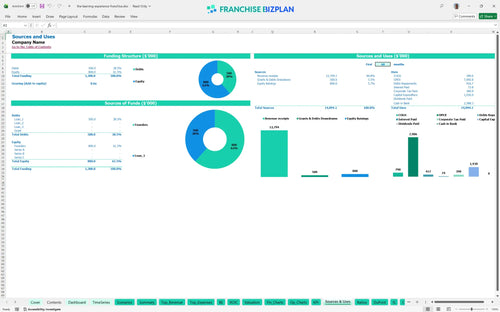
To meet the investment requirements for early education franchise, you need approximately $1,930,000 in initial capital plus a working capital buffer. Capital expenditure planning shows the largest expenses are the $850,000 leasehold improvements and the $450,000 specialized immersive play area build-out.
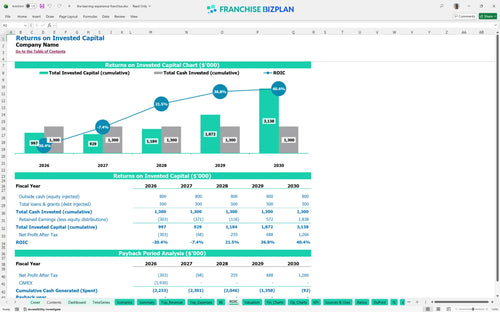
Your ROI calculation shows an internal rate of return of 1.63% and a 2.3 ROE over the five-year period. While the payback period extends beyond year five due to the high entry cost, the year-five EBITDA of $1,882,000 suggests significant long-term equity value for the owner.
The unit hits its monthly break-even point in April 2026, just four months after launching tuition services. Estimating operating expenses for preschool franchise shows the primary driver is reaching a critical mass of full-time students to cover the $22,000 monthly rent and $85,000 director salary.

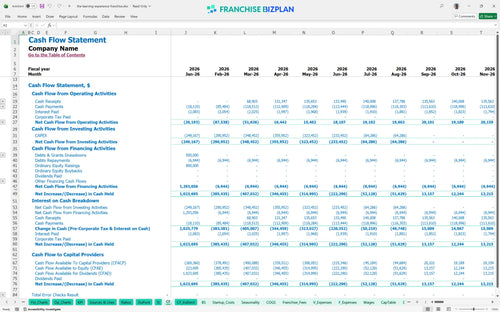
When learning how to build a financial model for a daycare franchise, you will see the lowest cash point occurs in August 2026 at negative $756,000. You should defintely have a contingency fund or financing in place to handle the months between build-out and full enrollment ramp-up.
Your franchise business plan financial spreadsheet shows that a high-performance case pulls the payback period forward significantly. Revenue forecasting for childcare franchise units indicates that even a 10% drop in enrollment can increase the peak cash need by hundreds of thousands during the first year.
Finance: update unit break-even and payback model by Friday.
This childcare franchise financial model is built in Excel with open formulas, so you can adjust every assumption to fit your specific territory. Whether you are tweaking enrollment numbers or local labor rates, the pre-filled cells in this childcare franchise financial model excel template update instantly to show your projected bottom line.

Planning for the long term is vital when you are managing a preschool business plan. This financial forecasting spreadsheet provides a detailed 5-year outlook on revenue, cash flow, and tax obligations to help you see the path from opening day to a mature, high-volume center.

The model tracks the 7% royalty and 1% marketing fund contributions against your gross tuition revenue. This ensures you see the exact impact of brand costs on your store-level margin before you commit to the childcare franchise investment analysis.

Use this tool to learn how to calculate startup costs for a daycare franchise and map out your initial $1,930,000 investment. You will find the exact month your tuition revenue covers your fixed costs, helping you perform a detailed break-even analysis during the ramp-up phase.

We included childcare franchise investment analysis benchmarks for labor and rent to keep your projections grounded. Comparing your operating expense ratio against industry averages helps you spot margin leaks before they become permanent problems.


Simply purchase and download the financial model template, then access it instantly using Microsoft Excel or Google Sheets. No installation or technical expertise required-just open and start working.

Enter your business-specific numbers, including revenue projections, costs, and investment details. The pre-built formulas will automatically calculate financial insights, saving you time and effort.

Leverage the investor-ready format to confidently showcase your financial projections to banks, franchise representatives, or investors. Impress stakeholders with clear, data-driven insights and professional reports.

Leverage the investor-ready format to confidently present your projections to banks, franchise representatives, or investors.