
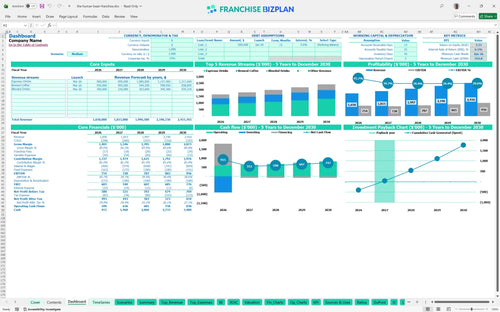
All-in-one Dashboard
Core inputs and core outputs


This pro forma financial statements package includes a detailed startup budget, a five-year income statement, and a dynamic investment return calculator for drive-thru coffee operators.
Core inputs and core outputs
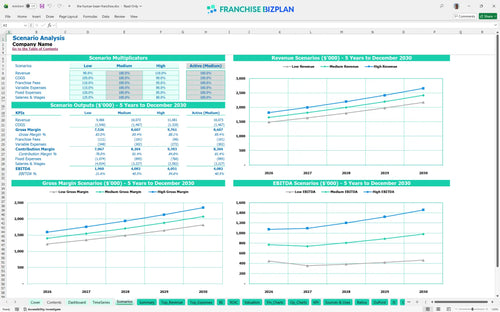
Three scenario analysis
Presentation ready
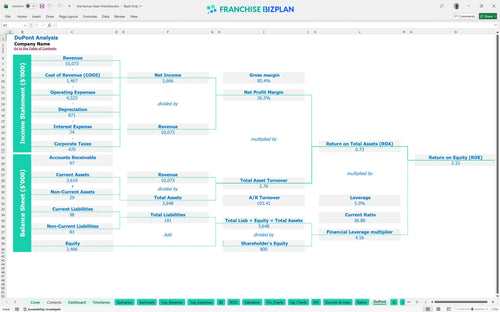
DuPont analysis
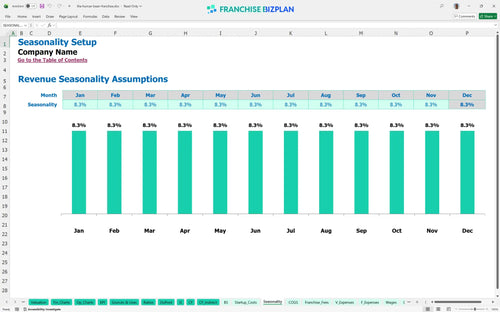
Researched revenue assumptions
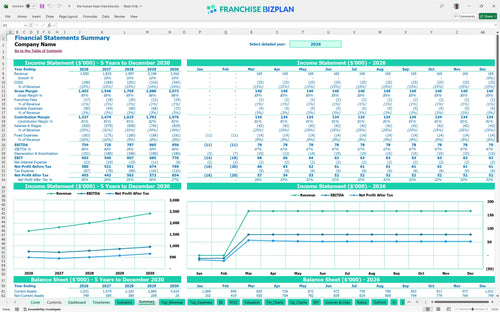
Lender-friendly financial outputs
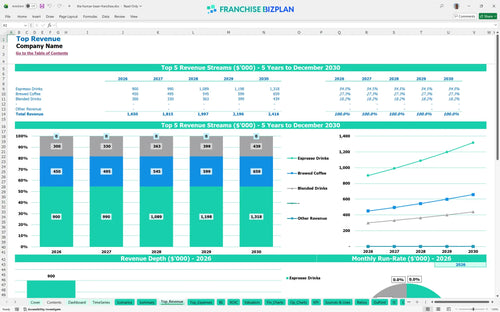
Revenue stream detailed view
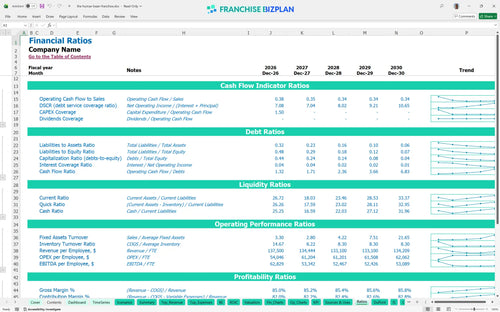
Performance metrics benchmark
We built this franchise unit financial model using our own research into high-volume drive-thru coffee operations. Key assumptions, including the $1.65M year-one revenue, the 0% royalty structure, and the $900,000 total startup cost, are pre-populated with researched data specific to this unit and are fully editable.
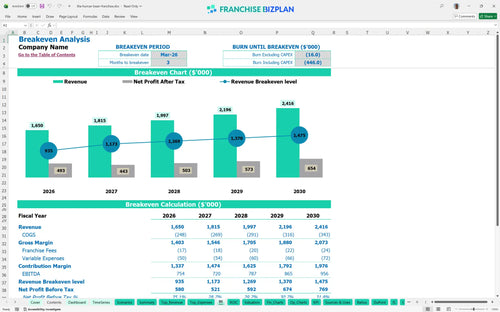
This unit hits profitability almost immediately, reaching its break-even point by March 2026. Because there is no royalty burden, the store-level EBITDA starts at a strong $754,000 in the first year, provided you maintain high throughput at the window. Speed is the only currency that matters in a double-sided drive-thru.
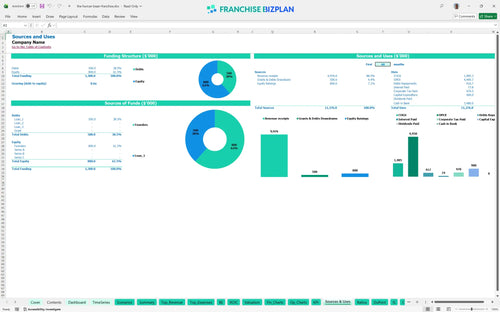
You need a total of $900,000 to get the window open and the espresso flowing. This covers the $30,000 franchise fee and heavy physical costs like the $350,000 in leasehold improvements and $200,000 for drive-thru construction. You aren't just buying coffee beans; you're buying a $200,000 traffic machine.
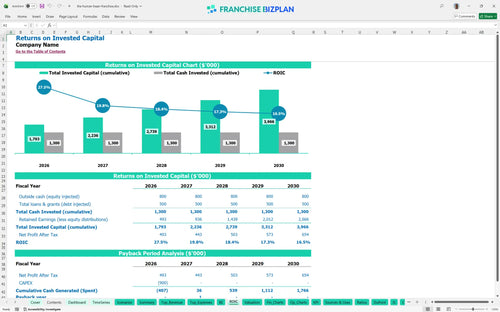
The model projects a quick 2-year payback period on your initial $900,000 investment. With an Internal Rate of Return (IRR) of 6.48% and a Return on Equity (ROE) of 3.33, the unit offers a stable return for operators who can manage high-volume labor. A two-year payback is a rare win in the current franchise landscape.
The unit reaches break-even in just 3 months, which is realy fast for a brick-and-mortar operation. To cover your $14,150 in monthly fixed costs, you need to lean on your $600,000 annual espresso drink volume and keep your 12% ingredient cost in check. Every wasted second at the window is a leak in your break-even bucket.
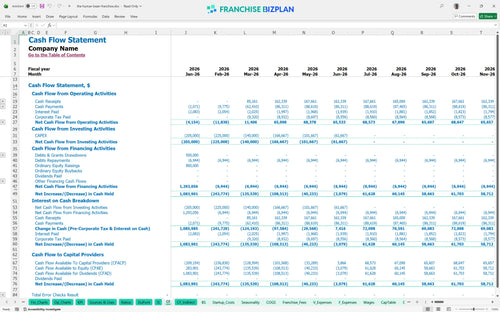
Your lowest cash point hits in June 2026 at $553,000, so you have a significant buffer if you hit the $900,000 investment target. Still, you need to watch the ramp-up closely to ensure the 12 baristas and management team don't outpace your early traffic. Cash is oxygen, and your lowest point is often closer than you think.
The 0% royalty structure means that in a High scenario, almost every extra dollar of revenue drops to the bottom line after COGS. If you hit the $2.4M revenue target by year five, your EBITDA margin stays strong because your fixed costs like the $9,000 rent don't scale with your coffee volume. The difference between a good year and a great one is your local marketing execution.
Finance: update unit break-even and payback model by Friday.
This franchise financial model is a defintely flexible Excel tool that lets you swap out every variable to match your specific territory. It comes pre-loaded with formulas and researched assumptions, so you can adjust everything from local labor rates to the price of a latte without breaking the logic.

Mapping out a five-year horizon is critical for any coffee shop business plan to see how scaling affects the bottom line. This model tracks your growth from an initial $1.65 million in year-one sales to over $2.4 million by year five, helping you visualize long-term cash flow and debt service capacity.

The model handles the unique financial mechanics of this drive-thru concept, specifically the $30,000 upfront fee and the 0% royalty structure. By isolating the 1% marketing fund contribution, you can see exactly how much profit stays in your pocket compared to traditional royalty-heavy brands.

Knowing your coffee franchise startup costs is the first step to avoiding a liquidity crunch during the build-out phase. This tool aggregates your $900,000 initial investment and calculates the exact sales volume needed to cover your $14,150 in monthly fixed costs.

We've integrated real-world unit economics to help you sanity-check your projections against industry standards. Whether you are looking at barista labor or drive-thru site rent, these benchmarks ensure your franchise financial template reflects the reality of the US coffee market.


Simply purchase and download the financial model template, then access it instantly using Microsoft Excel or Google Sheets. No installation or technical expertise required-just open and start working.

Enter your business-specific numbers, including revenue projections, costs, and investment details. The pre-built formulas will automatically calculate financial insights, saving you time and effort.

Leverage the investor-ready format to confidently showcase your financial projections to banks, franchise representatives, or investors. Impress stakeholders with clear, data-driven insights and professional reports.

Leverage the investor-ready format to confidently present your projections to banks, franchise representatives, or investors.