
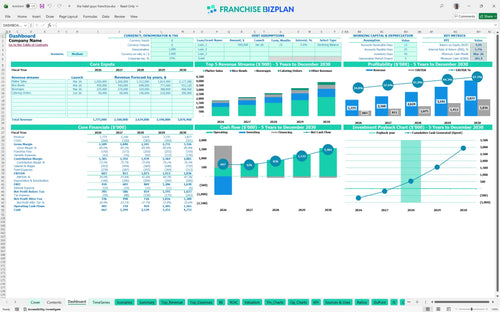
All-in-one Dashboard
Core inputs and core outputs


This financial model provides a complete, data-driven roadmap for launching and scaling a high-volume fast-casual unit with precision and clarity.
Core inputs and core outputs
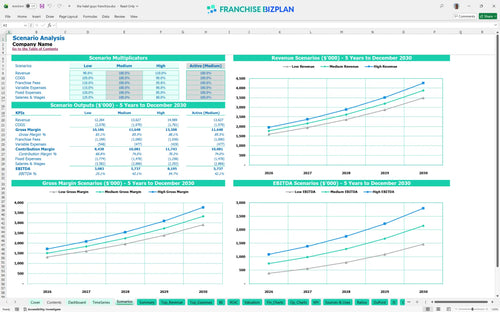
Three scenario analysis
Presentation ready
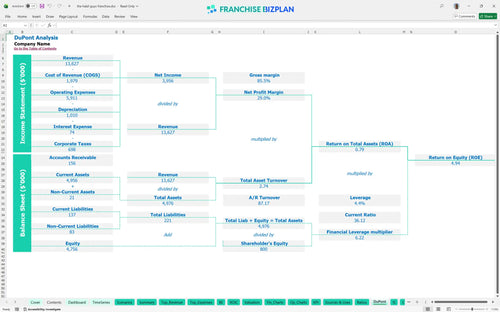
DuPont analysis
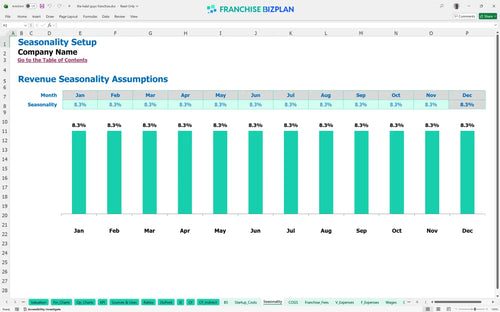
Researched revenue assumptions
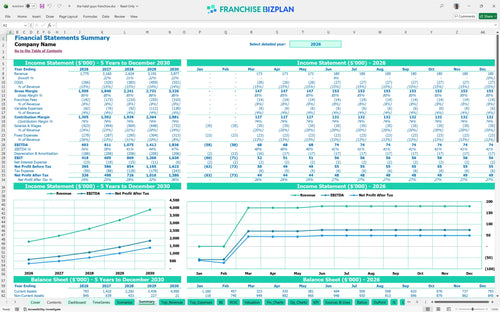
Lender-friendly financial outputs
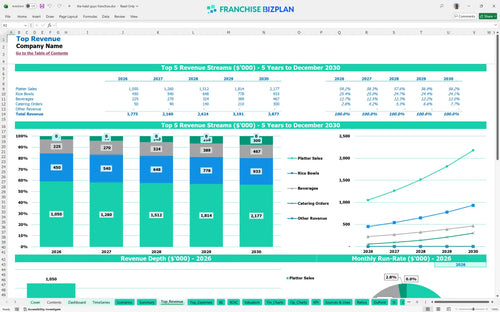
Revenue stream detailed view
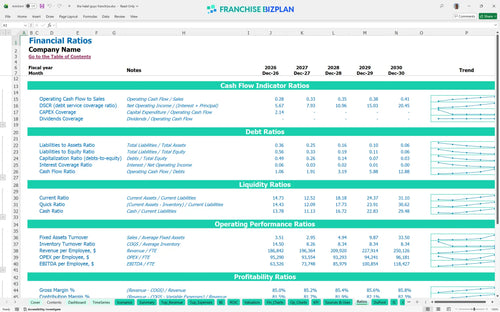
Performance metrics benchmark
We built this franchise unit financial model using our own research into high-throughput Mediterranean concepts. Key assumptions, including the $1.77M Year 1 revenue and $603,000 EBITDA, are pre-populated with researched data and remain fully editable. This tool is essential for assessing profitability of a fast casual restaurant unit while managing the $1.03M initial capital outlay.
The unit reaches profitability in Year 1, generating a projected $603,000 in EBITDA after accounting for food costs and royalties. This trajectory is defintely strong, as revenue is expected to grow from $1.7M to $3.8M by Year 5 through expanded catering and high-volume platter sales. A fast casual franchise profitability analysis shows that tight waste management is the key to protecting these margins.
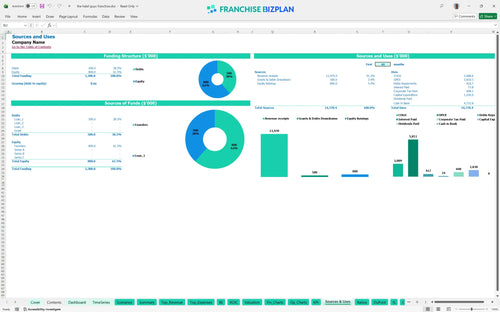
Launching this unit in the US requires an initial investment of approximately $1,030,000 to cover the $60,000 franchise fee and extensive build-out. This guide on how to calculate startup costs for a food franchise shows that the bulk of your capital expenditure budgeting goes toward leaseholds and kitchen gear. You will also need to maintain a cash buffer to handle the $16,500 monthly rent during the ramp-up phase.
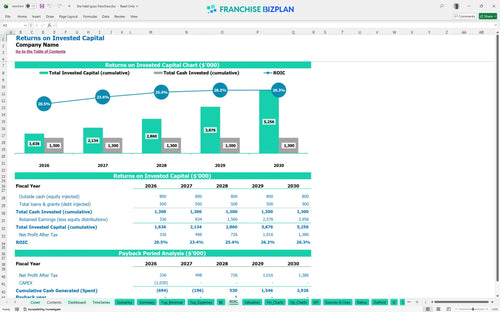
Investors can expect an Internal Rate of Return (IRR) of 5.69% and a full payback of the initial investment within 3 years. When evaluating franchise investment opportunities with financial models, these metrics highlight a stable, cash-flowing asset with a 4.94% ROE. Estimating labor costs for high volume restaurant operations is critical here, as payroll for a 10-person crew impacts your long-term ROI analysis.
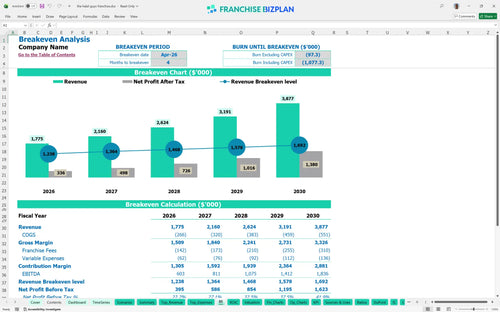
The unit hits its monthly break-even point in April 2026, just four months after the January launch. This rapid turnaround depends on maintaining high platter sales volume to offset the $16,500 monthly rent and $1,300 property insurance costs. In a high-traffic urban corridor, throughput speed is the primary lever that determines how quickly you stop burning cash.
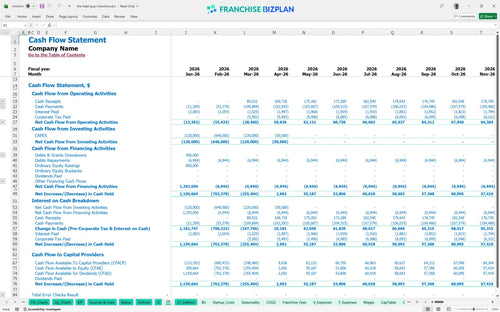
The lowest cash point is projected at $202,000 in March 2026, requiring a disciplined approach to working capital during the first quarter. Using a restaurant franchise cash flow statement template helps you monitor the $11,500 monthly management salary load against incoming daily receipts. Still, you should keep a contingency fund ready in case the HVAC installation or signage costs exceed the $90,000 combined estimate.
A franchise unit financial feasibility study template shows that hitting the high-case scenario requires scaling catering revenue from $50,000 to $300,000 by Year 5. Financial projections for a new franchise location can swing wildly based on local marketing execution and your ability to capture the university demographic. Analyzing recurring revenue for restaurant locations reveals that digital loyalty programs are the best way to move from a low to a high-performance unit.
Finance: update unit break-even and payback model by Friday.
This franchise financial model template provides a professional-grade structure in Excel for evaluating a single territory or unit. It features pre-filled formulas and editable assumptions, allowing you to swap out local tax rates, specific lease terms, or adjusted vendor pricing to see how they impact your bottom line. Use this franchise business plan Excel tool to move from 'what if' to a concrete operating plan in minutes.

Planning for the long term requires more than a simple monthly budget, so this model delivers detailed restaurant franchise financial projections through year five. It maps out the transition from a high-growth startup phase to a mature unit, including automated operating expense forecasting that adjusts as your volume increases. This Excel template for restaurant franchise financial forecasting ensures you can see the impact of annual rent escalations and labor market shifts before they happen.

The model simplifies the complex franchise royalty fee calculation by automating the 6% royalty and 2% brand marketing fund deductions directly from gross sales. It accounts for the $60,000 initial franchise fee and ensures that every dollar paid to the franchisor is tracked against your store-level margin. Understanding these recurring obligations is vital for maintaining a realistic view of your net take-home pay after the corporate office gets their cut.

Our franchise startup cost calculator totals your initial capital requirements, including the $500,000 leasehold improvements and $200,000 in kitchen equipment. Determining break-even point for food service franchise units is easier when you can visualize the exact month where cumulative cash flow turns positive. This analysis helps you set realistic sales targets for your crew and manage investor expectations during the critical first year of operation.

We have integrated unit economics benchmarks to help you sanity-check your $16,500 monthly rent and labor allocations against industry standards. By comparing your projected gross margins and occupancy costs to typical fast-casual ranges, you can identify if your site selection or staffing levels are out of sync with the market. Use these benchmarks to justify your financial assumptions to lenders and partners with data-backed confidence.


Simply purchase and download the financial model template, then access it instantly using Microsoft Excel or Google Sheets. No installation or technical expertise required-just open and start working.

Enter your business-specific numbers, including revenue projections, costs, and investment details. The pre-built formulas will automatically calculate financial insights, saving you time and effort.

Leverage the investor-ready format to confidently showcase your financial projections to banks, franchise representatives, or investors. Impress stakeholders with clear, data-driven insights and professional reports.

Leverage the investor-ready format to confidently present your projections to banks, franchise representatives, or investors.