
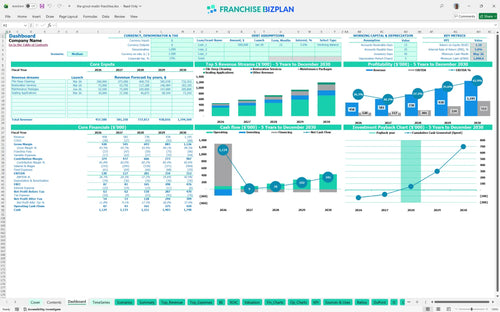
All-in-one Dashboard
Core inputs and core outputs


This franchise unit financial model template provides a professional Excel-based tool to forecast 5-year P&L, cash flow, and ROI for a new tile restoration business.
Core inputs and core outputs
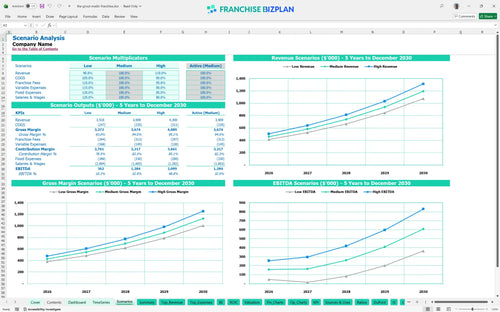
Three scenario analysis
Presentation ready
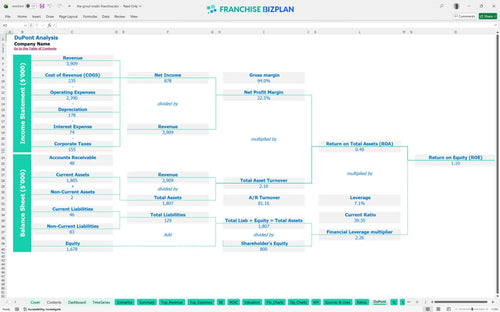
DuPont analysis
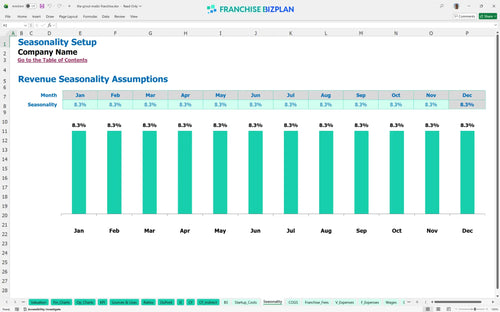
Researched revenue assumptions
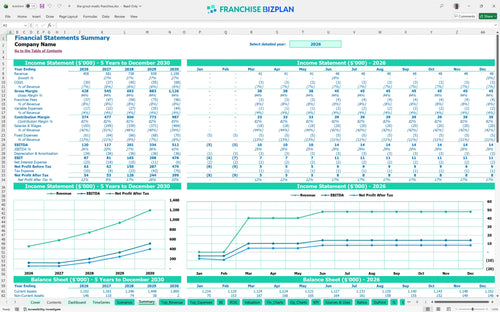
Lender-friendly financial outputs
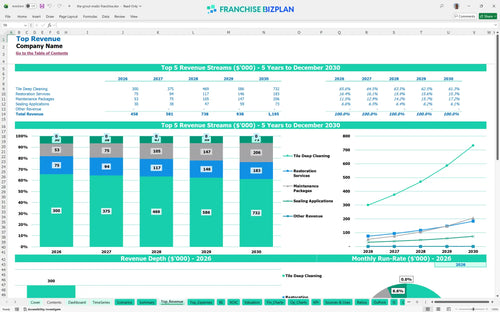
Revenue stream detailed view
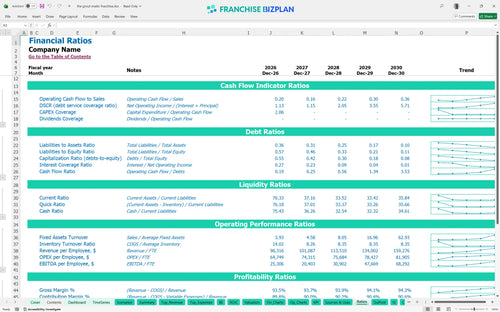
Performance metrics benchmark
We built this franchise unit financial model using deep research into the tile and grout restoration industry. Key assumptions for revenue streams like deep cleaning and sealing, along with operating expenses and royalties, are pre-populated and fully editable. Year 1 revenue is projected at $458,000 with an EBITDA of $120,000, providing a solid baseline for your financial planning for new franchise owners.
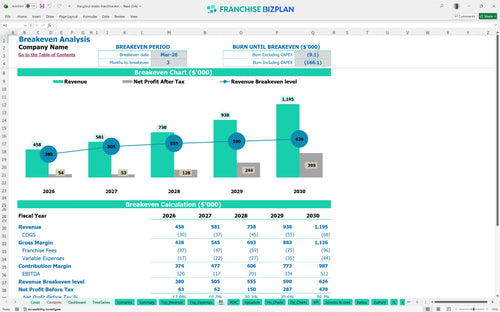
This franchise unit reaches profitability quickly, with a break-even date in March 2026. After accounting for the 6% royalty and 2% marketing fees, the unit scales from a $120,000 EBITDA in Year 1 to $512,000 by Year 5. Profitability is driven by high-margin restoration services and scaling your technician count from 2.5 to 4.5 over five years.
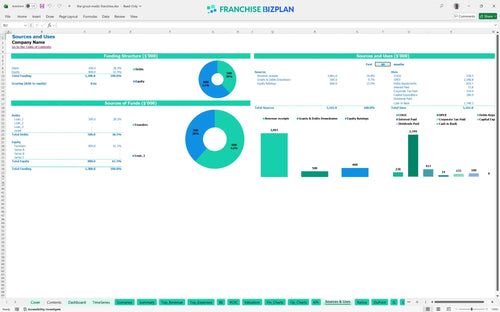
You need a total initial investment to cover the $65,000 franchise fee and significant equipment costs. Major capital expenditure planning includes $45,000 for service vehicles and $25,000 for vapor steam technology. Plus, you should account for the $15,000 office fitout and $12,000 in initial marketing to seed the local market before the March launch.
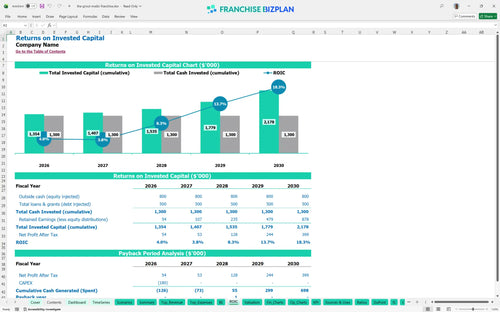
The ROI calculation for this unit shows a 3-year payback period, which is standard for high-demand home services. The internal rate of return (IRR) is 5.77%, and the return on equity (ROE) stands at 1.1. As revenue grows from $458,000 to over $1.1M, the cash flow multiples become highly attractive for multi-unit operators looking to exit or recapitalize.
The unit hits its monthly break-even point in just 3 months. To cover the $5,200 in fixed monthly operating expenses-including rent, insurance, and vehicle leases-you need to focus on volume in the Tile Deep Cleaning segment. This is the primary revenue driver, starting at $200,000 in the first year and growing steadily to support the fixed cost structure.
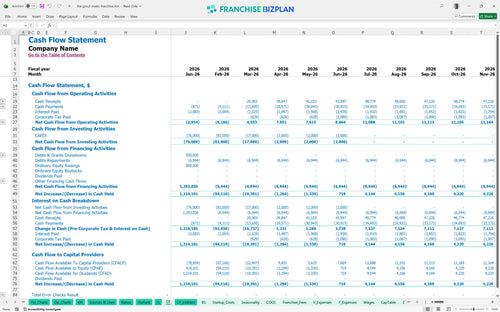
The lowest cash point is $1,098,000 in May 2026, which includes your initial investment and ramp-up losses. You defintely need to ensure your working capital is sufficient to cover the gap between hiring your 2.5 technicians in March and the steady collection of receivables. Monitoring your fuel and travel costs, currently at 2.5% of sales, is vital for protecting early cash flow.
In a High scenario, increasing your average ticket for restoration services can push Year 5 EBITDA well beyond the $512,000 baseline. Conversely, a Low scenario where technician productivity drops could extend the payback period beyond 3 years. Analyzing revenue streams for home maintenance franchises shows that even a 10% dip in volume significantly impacts the peak cash need during the first 12 months.
This franchise financial model is built in Excel with fully editable assumptions, allowing you to plug in your specific territory data. You can adjust every formula to match your local market, whether you are tweaking the service business financial model for a single territory or a small multi-unit expansion. It is a flexible franchise unit financial model spreadsheet that handles everything from revenue drivers to complex payroll schedules without locking you out of the math.

Planning for the long haul requires more than a simple P&L. This model provides 5-year revenue forecasts, showing growth from $458,000 in Year 1 to $1,195,000 by Year 5. It is the best practices for franchise unit financial forecasting, giving you a clear view of how your balance sheet and cash flow evolve as you scale your restoration services. You get a full 60-month outlook to help with capital expenditure planning and long-term debt service coverage.

Understanding royalty and franchise fee costs in financial models is critical for protecting your margins. This template automatically calculates the 6% royalty and 2% marketing fund contributions based on your monthly sales projections. It also accounts for the initial $65,000 franchise fee in your startup budget. This ensures you see the true net profit after all brand-related obligations are met, so there are no surprises during your first year of operation.

Knowing how to calculate startup costs for a home service franchise is the first step to securing funding. This model aggregates your $65,000 franchise fee, $45,000 vehicle costs, and $25,000 equipment needs into a clear startup budget template for service-based small businesses. The break-even analysis then tells you exactly when your monthly revenue covers both fixed and variable operating expenses, which is projected at month 3 for this specific unit.

Stop guessing about your operating expenses. This model includes researched benchmarks for labor, such as $34,000 for technicians and $65,000 for a general manager. It helps you sanity-check your rent, which we have pegged at $2,200 monthly, and your supply costs, which should hover around 5% of sales. Using these benchmarks allows you to build a more realistic franchise business plan template that lenders and investors will actually take seriously.


Simply purchase and download the financial model template, then access it instantly using Microsoft Excel or Google Sheets. No installation or technical expertise required-just open and start working.

Enter your business-specific numbers, including revenue projections, costs, and investment details. The pre-built formulas will automatically calculate financial insights, saving you time and effort.

Leverage the investor-ready format to confidently showcase your financial projections to banks, franchise representatives, or investors. Impress stakeholders with clear, data-driven insights and professional reports.

Leverage the investor-ready format to confidently present your projections to banks, franchise representatives, or investors.