


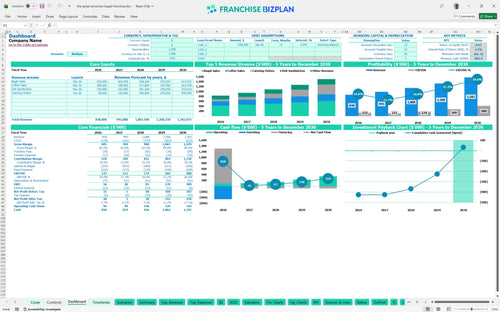
All-in-one Dashboard
Core inputs and core outputs



This comprehensive financial toolkit includes detailed pro forma statements, CAPEX scheduling, and multi-scenario analysis designed specifically for a high-volume bakery and deli franchise unit.
Core inputs and core outputs
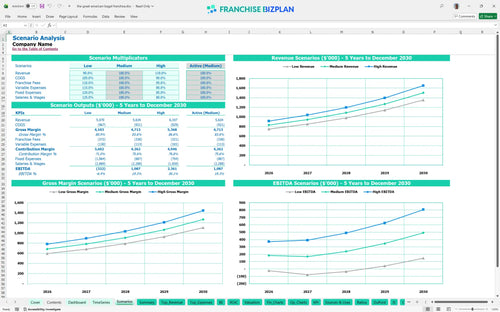
Three scenario analysis
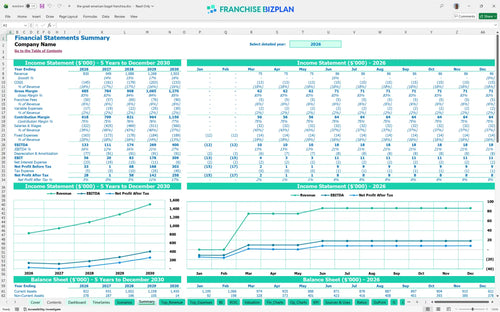
Presentation ready
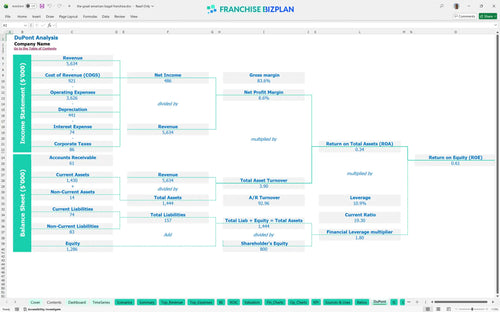
DuPont analysis
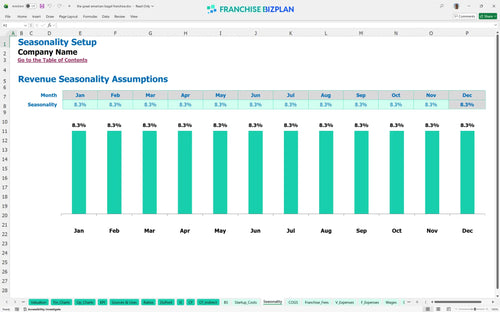
Researched revenue assumptions
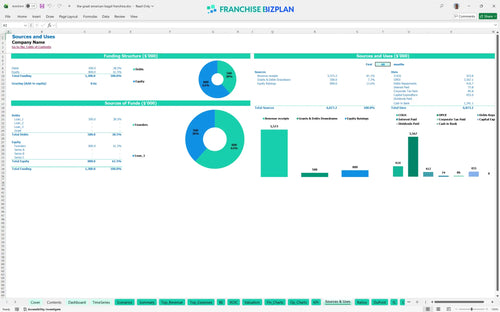
Lender-friendly financial outputs
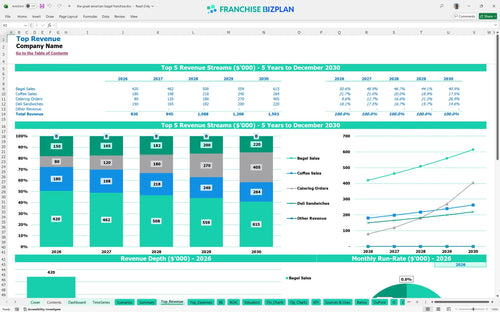
Revenue stream detailed view
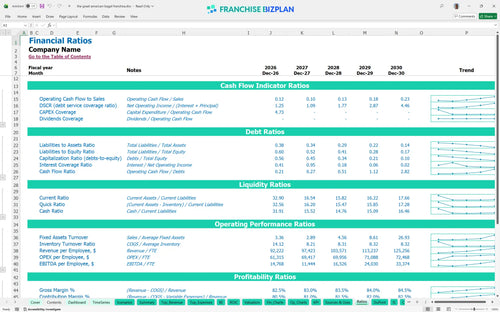
Performance metrics benchmark
We built this franchise unit financial model using deep-dive research into the bakery-cafe sector and typical franchise disclosures. The model arrives pre-populated with researched data for a standard unit, including a $133,000 Year 1 EBITDA and a 5-year payback period, but remains fully editable to match your specific lease terms and local labor market. It is designed to be a pragmatic tool for owners who need to see the real-world impact of 4% royalties and $9,500 monthly rent on their bottom line.
The unit reaches profitability early in its lifecycle, with a break-even date projected for April 2026. This franchise unit profit and loss statement example shows Year 1 EBITDA at $133,000, though Year 2 sees a slight dip to $111,000 as the operation stabilizes before climbing toward $400,000 by Year 5.
To launch this unit in the US, you need to account for $455,000 in primary CAPEX plus the $20,000 franchise fee. When learning how to calculate startup costs for a food franchise, it is vital to include the $220,000 for leasehold improvements and $110,000 for specialized baking equipment as shown in this startup budget template for retail food franchises.
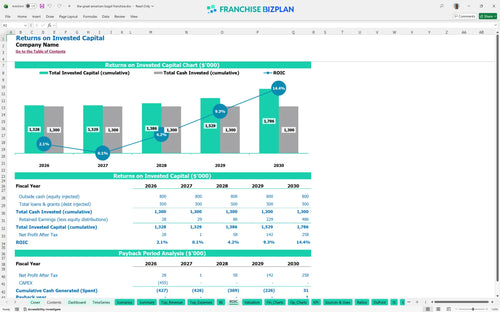
Investors can expect an Internal Rate of Return (IRR) of 2.09% and a Return on Equity (ROE) of 0.61 over the initial term. This ROI analysis indicates a 5-year payback period, which is standard for a heavy-CAPEX food service model where equipment and build-out costs are significant. Calculating ROI for local food service business requires this long-term view to account for the ramp-up in catering revenue.
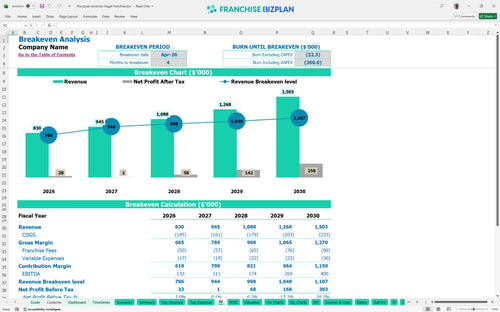
The monthly break-even point is achieved in month 4, specifically April 2026. Using this Excel template for restaurant franchise financial planning, we see that the primary driver for reaching this point is the $830,000 Year 1 revenue target, which relies heavily on the $280,000 bagel sales and $120,000 coffee sales. This speed defintely depends on maintaining a tight 15.5% food cost margin early on.
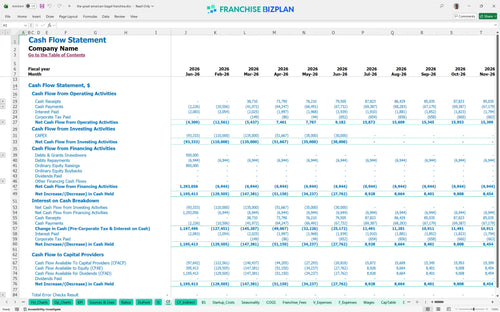
The lowest cash point for the operation is $805,000, occurring in June 2026. This cash flow forecasting tool suggests you need a solid runway to cover the $9,500 monthly rent and $203,000 in initial annual wages before the catering revenue stream fully matures. Your operating expenses spreadsheet should always include a buffer for these early months of operation.
Financial modeling for multi-unit franchise expansion shows that a 'High' scenario is driven by the catering segment growing from $80,000 to $405,000. If catering lags or if the $28,000 crew member salaries rise faster than the 5.0 FTE plan, the Year 1 margin will tighten significantly, delaying the 5-year payback target.
This franchise financial model template is built in Excel with fully editable assumptions, allowing you to plug in your specific territory data and local market costs. It acts as a comprehensive restaurant franchise business plan tool where you can adjust everything from bagel production volume to coffee attachment rates without breaking the underlying logic. The pre-filled formulas handle the heavy lifting, so you can focus on testing different operating scenarios for your bakery-deli unit.

Success in the food industry requires looking beyond the grand opening to understand long-term sustainability and growth. This model provides a detailed franchise unit profitability analysis and bakery franchise financial projections spanning five years, covering revenue growth, margin expansion, and cash flow requirements. You can track how scaling from $830,000 in Year 1 to over $1.5 million in Year 5 impacts your bottom line and overall store-level valuation.

Managing the financial obligations to the franchisor is critical for maintaining healthy store-level margins. The model automatically calculates franchise royalty fees at 4% and marketing fund contributions at 2%, ensuring these costs are accounted for before you calculate your take-home pay. By analyzing franchise royalty and marketing fund costs alongside local overhead, you get a realistic view of the net contribution from every bagel and sandwich sold.

Launching a new location requires a clear roadmap of the total initial investment, from the $20,000 franchise fee to the $220,000 needed for leasehold improvements. This franchise startup cost calculator helps you visualize the total capital outlay and perform a break-even point calculation to see exactly when your monthly sales will cover both fixed and variable expenses. Knowing your 'zero-profit' number helps you manage labor and inventory more effectively during the critical first year.

We have integrated industry-standard benchmarks to help you sanity-check your projections against typical bakery-cafe performance. This is especially helpful for estimating labor costs for bakery franchise operations, ensuring your staffing levels for bakers and crew members align with high-volume morning traffic. By comparing your rent, food costs, and labor percentages against these benchmarks, you can identify potential margin leaks before they impact your cash flow.


Simply purchase and download the financial model template, then access it instantly using Microsoft Excel or Google Sheets. No installation or technical expertise required-just open and start working.

Enter your business-specific numbers, including revenue projections, costs, and investment details. The pre-built formulas will automatically calculate financial insights, saving you time and effort.

Leverage the investor-ready format to confidently showcase your financial projections to banks, franchise representatives, or investors. Impress stakeholders with clear, data-driven insights and professional reports.

Leverage the investor-ready format to confidently present your projections to banks, franchise representatives, or investors.