
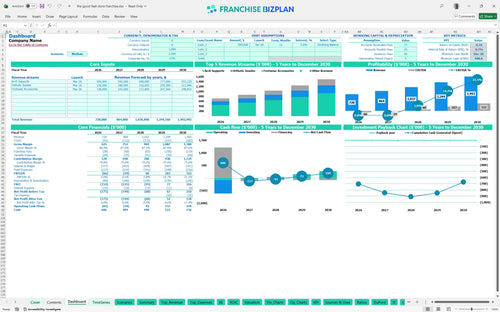
All-in-one Dashboard
Core inputs and core outputs


This product provides a comprehensive financial forecasting tool for medical retail franchises, covering everything from initial build-out to five-year exit valuations.
Core inputs and core outputs
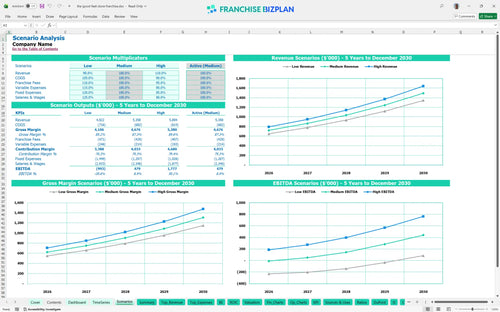
Three scenario analysis
Presentation ready
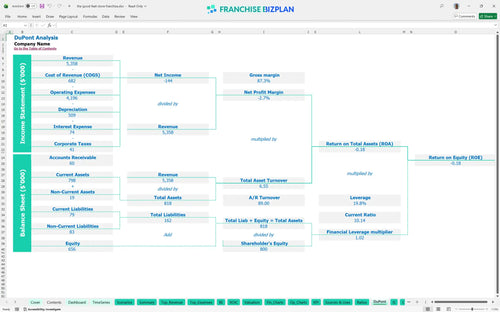
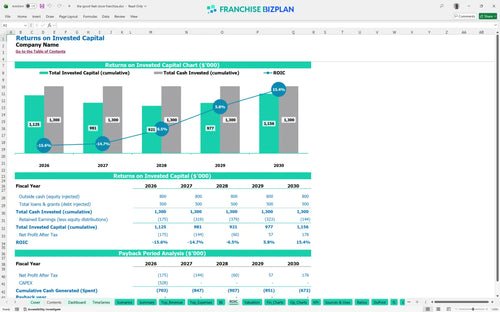
DuPont analysis
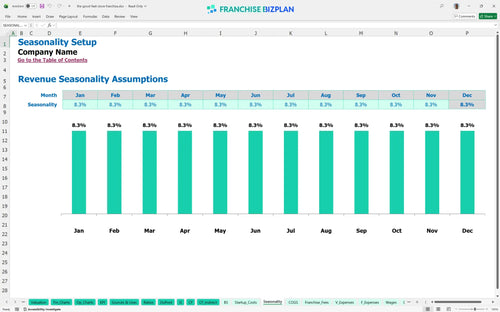
Researched revenue assumptions
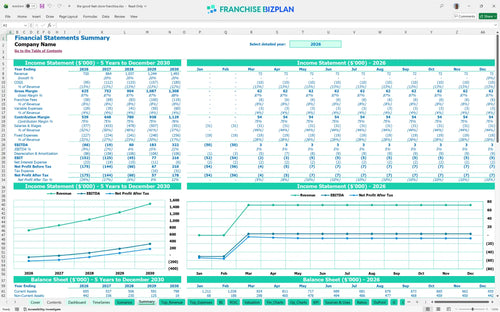
Lender-friendly financial outputs
Revenue stream detailed view
Performance metrics benchmark
We built this franchise unit financial model using our own research into high-end wellness retail operations. Key assumptions, including the $720,000 year-one revenue and $220,000 leasehold improvements, are pre-populated and fully editable. This pre-written financial model for health and wellness franchises helps you evaluate the $322,000 year-five EBITDA potential while managing the 8% total fee burden.
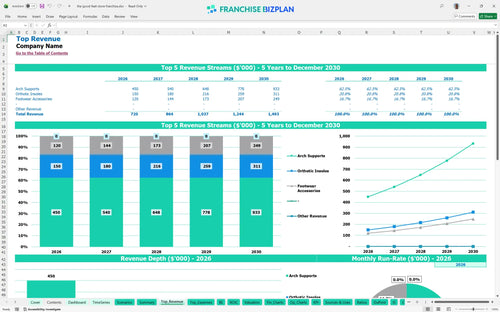
The unit reaches positive EBITDA by year three, generating $60,000 after navigating initial ramp-up losses. This franchise unit profitability analysis shows that profitability depends on scaling arch support sales from $300,000 to over $622,000 by year five while managing a 13% inventory cost.
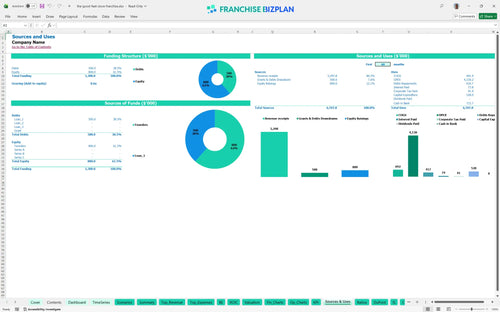
You need a $528,000 franchise startup cost spreadsheet to cover the total initial investment. This includes the $25,000 franchise fee, $220,000 for leasehold improvements, and $110,000 for specialized digital gait analysis and fitting equipment required for brand standards.
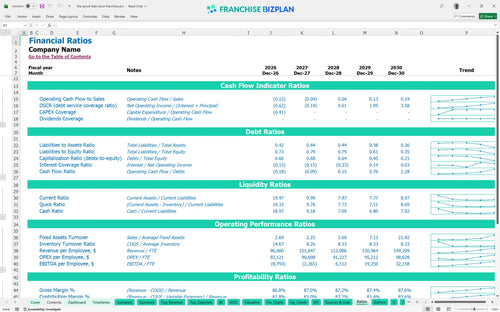
Evaluating return on investment for high-end retail franchises reveals a payback period extending beyond five years with a -0.67% IRR. While the year-five EBITDA margin is strong at 21%, the heavy upfront CAPEX (capital expenditure) means you are playing a long-term equity game.
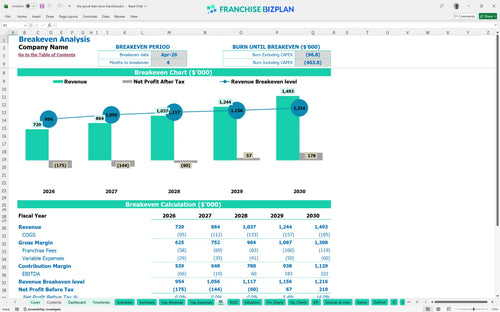
Your break-even analysis indicates you hit the monthly break-even point in April 2026, just four months after launch. To sustain this, you must cover $19,300 in monthly fixed costs plus the 8% royalty and marketing burden through high-ticket arch support fittings.
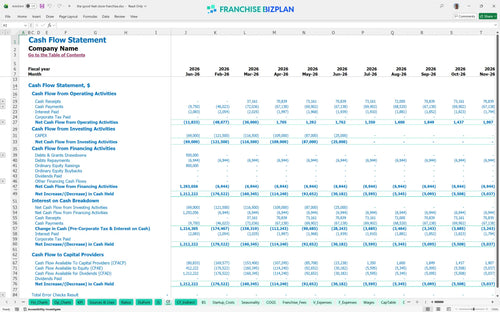
The lowest cash point occurs in December 2028 at $448,000, assuming you start with full funding. Estimating recurring monthly costs for a franchise location is vital here, as you must carry the store through two years of negative EBITDA before the cash flow stabilizes.
A 10% revenue drop in the low scenario significantly extends your payback period and increases the year-one EBITDA loss. Conversely, hitting high-case targets through better local marketing execution can defintely push your year-five EBITDA toward the $400,000 mark.
Finance: update unit break-even and payback model by Friday.
This franchise financial model template is fully customizable in Excel, allowing you to adjust every variable from Kierland Commons rent to local specialist wages. It features pre-filled formulas and editable assumptions, making it easy to adapt the tool to your specific territory and local market conditions.

Plan your multi-unit growth or single-store trajectory with detailed 5-year projections. This franchise business plan financial projections Excel tool maps out revenue scaling from $720,000 in year one to over $1.49 million by year five, helping you visualize long-term store-level EBITDA and cash flow.

Analyzing franchise royalty and marketing fund expenses is critical for understanding your true take-home pay. The model automatically calculates the 5% royalty and 3% marketing fee against your projected sales, ensuring your operating expenses spreadsheet reflects the actual costs of the franchise agreement.

How to calculate startup costs for a retail franchise becomes simple with this pre-built capital expenditure forecasting tool. It identifies the $528,000 initial investment and performs a break-even analysis to show exactly when your monthly revenue covers fixed costs like the $14,500 rent.

This Excel template for analyzing franchise unit profitability includes built-in benchmarks for labor and occupancy. You can sanity-check your $319,000+ year-one payroll against industry standards for high-end wellness retail to ensure your staffing levels for specialists and managers are efficient.


Simply purchase and download the financial model template, then access it instantly using Microsoft Excel or Google Sheets. No installation or technical expertise required-just open and start working.

Enter your business-specific numbers, including revenue projections, costs, and investment details. The pre-built formulas will automatically calculate financial insights, saving you time and effort.

Leverage the investor-ready format to confidently showcase your financial projections to banks, franchise representatives, or investors. Impress stakeholders with clear, data-driven insights and professional reports.

Leverage the investor-ready format to confidently present your projections to banks, franchise representatives, or investors.