
All-in-one Dashboard
Core inputs and core outputs


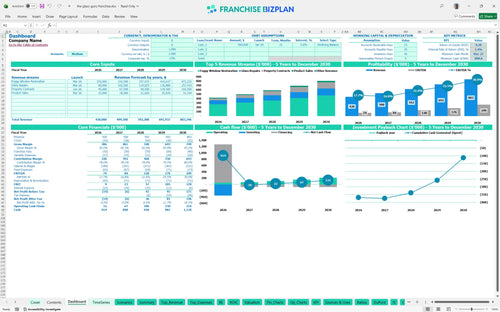
This franchise unit profitability tracker provides a complete roadmap from your initial $49,500 franchise fee to a mature five-year operation with detailed cash flow views.
Core inputs and core outputs
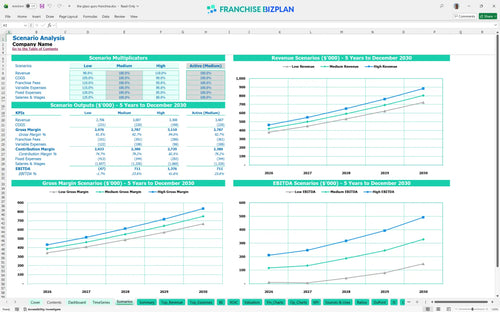
Three scenario analysis
Presentation ready
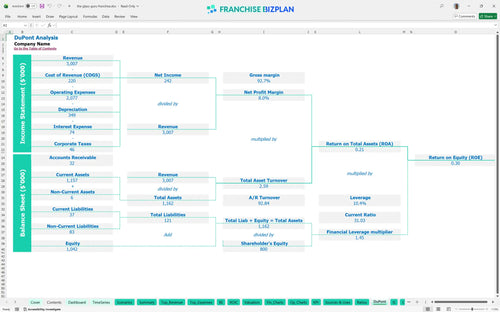
DuPont analysis
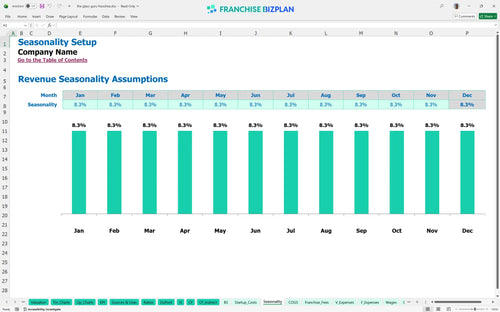
Researched revenue assumptions
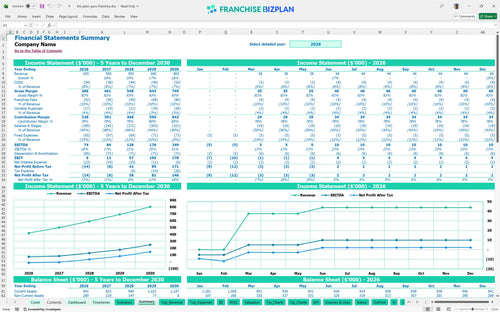
Lender-friendly financial outputs
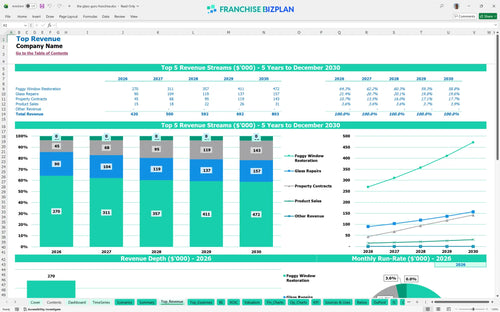
Revenue stream detailed view
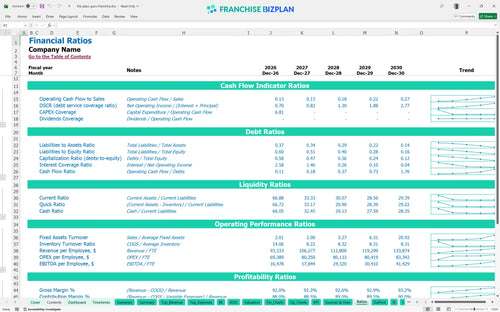
Performance metrics benchmark
We built this franchise unit financial model using our own research to ensure your projections are grounded in reality. Key assumptions like the $120,000 vehicle investment and tiered technician staffing are pre-populated but fully editable to fit your local market. With a projected Year 1 EBITDA of $74,000, this tool helps you verify if the numbers actually work for your specific territory.
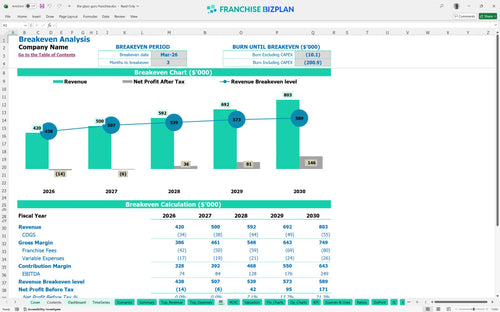
Profitability arrives quickly in this model, with the break-even date hitting in March 2026, just three months after launch. By Year 3, you are looking at an EBITDA of $128,000 after accounting for the 10% total brand fees and rising labor costs. Here is the quick math: keeping fuel and travel under 3% is vital for maintaining these margins as you scale.
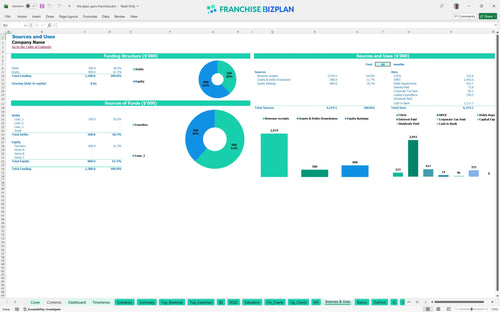
You will need roughly $354,500 in total CAPEX to get this unit off the ground in the US. This covers everything from the $49,500 entry fee to a significant $120,000 investment in service vehicles and $80,000 for the shop fitout. What this estimate hides is the need for a cash buffer to handle the early ramp-up phase before the property contracts kick in.
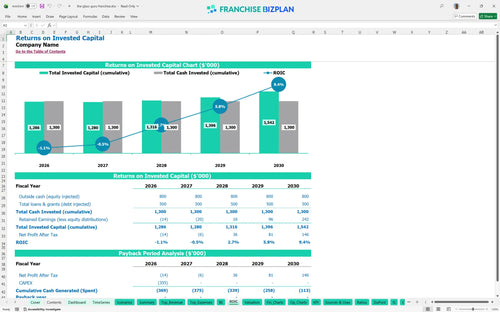
Analyzing return on investment for a new franchise location shows a steady climb, though the high initial CAPEX means full payback happens after Year 5. The model shows an IRR of 1.44% and a Year 5 EBITDA of $249,000. Honestly, this is a long-term equity play focused on building a stable local service monopoly rather than a quick flip.
You hit the monthly break-even point just 3 months after the March 2026 launch. To cover your $5,400 in fixed monthly costs (rent, utilities, insurance) plus royalties, you need to move fast on foggy window restoration jobs. The biggest lever here is technician productivity and scheduling density in your primary service area.
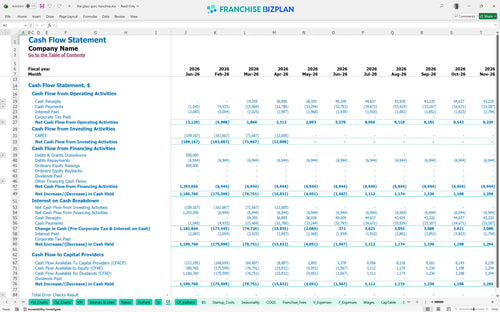
Your lowest cash point is projected for December 2027 at $898,000, assuming you started with significant capital to cover the $354,500 startup. If your opening takes longer than 90 days, the pressure on working capital rises fast. Still, the model suggests a stable path if you manage your $15,000 initial inventory wisely and avoid over-stocking early on.
Moving from a Medium to a High scenario can drastically pull forward your payback period. A 10% lift in revenue for window restoration business units often drops straight to the bottom line since your $3,500 rent is fixed. Conversely, a Low case might mean you need to delay hiring that second technician to keep the Year 1 margin near the projected 17%.
Finance: update unit break-even and payback model by Friday.
This franchise financial model template is built in Excel so you can tweak every variable to match your specific territory. Whether you are adjusting for local labor rates or specific rent prices, the pre-filled formulas handle the heavy lifting. It is a plug-and-play franchise startup cost spreadsheet that lets you own your projections without starting from scratch.

Long-term planning is the difference between a job and a business. This tool provides a clear view of your financial forecasting for franchise owners, scaling from $420,000 in year one to over $800,000 by year five. You can see how scaling your technician count from two to three impacts your bottom line over time as you grow your local footprint.

Off-the-top fees can eat your margin if you don't plan for them properly. The model accounts for a 7% franchise royalty structure and a 3% marketing fund, totaling a 10% hit on gross sales. Seeing these numbers monthly helps you understand the real economics of operating the unit while utilizing the brand's proprietary technology and support systems.

Starting a mobile service business involves more than just a truck and some tools. This model includes a break-even point calculation to show exactly when your restoration and repair revenue covers your $3,500 monthly rent and $14,000+ monthly payroll. It defintely helps you visualize the total initial investment before you sign a lease.

Don't fly blind when estimating operating expenses for window restoration business units. We have baked in benchmarks for glass and sealants (starting at 6.5%) and fuel costs (2.8%) so you can see if your unit is running lean. It is a vital sanity check for any business plan for home service franchise operations.


Simply purchase and download the financial model template, then access it instantly using Microsoft Excel or Google Sheets. No installation or technical expertise required-just open and start working.

Enter your business-specific numbers, including revenue projections, costs, and investment details. The pre-built formulas will automatically calculate financial insights, saving you time and effort.

Leverage the investor-ready format to confidently showcase your financial projections to banks, franchise representatives, or investors. Impress stakeholders with clear, data-driven insights and professional reports.

Leverage the investor-ready format to confidently present your projections to banks, franchise representatives, or investors.