
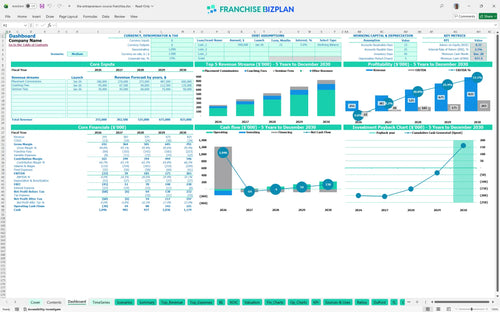
All-in-one Dashboard
Core inputs and core outputs


This financial model template for franchise owners includes interactive dashboards, automated financial statements, and detailed calculators for payroll, CAPEX, and multi-year revenue growth.
Core inputs and core outputs
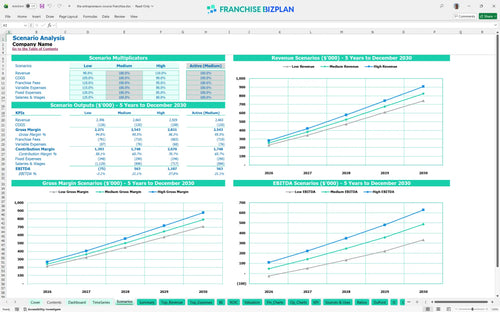
Three scenario analysis
Presentation ready
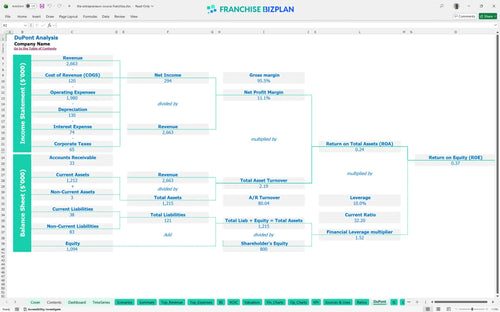
DuPont analysis
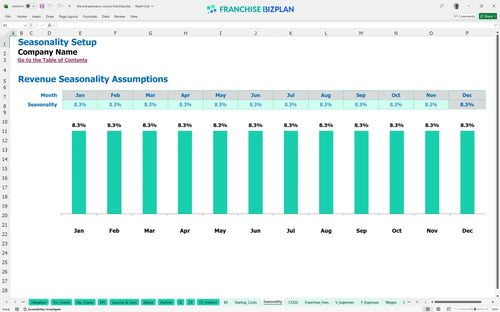
Researched revenue assumptions
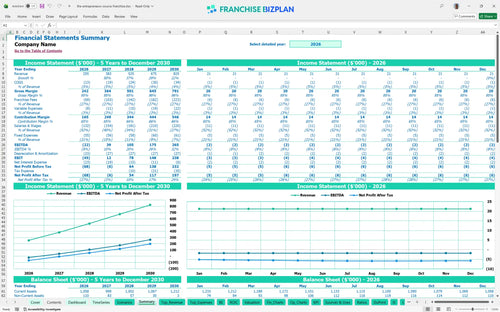
Lender-friendly financial outputs
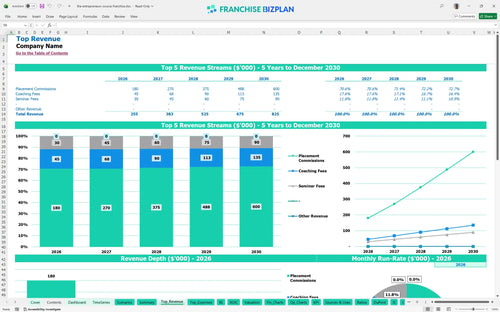
Revenue stream detailed view
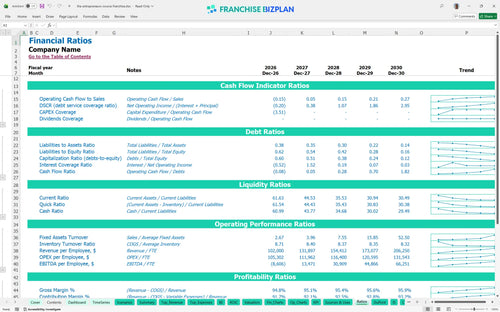
Performance metrics benchmark
We built this model using detailed research to help you evaluate a franchise business opportunity with confidence. The assumptions for placement commissions, coaching fees, and operating expenses like the $2,500 monthly co-working membership are pre-populated and fully editable. With a year one revenue target of $255,000 and a 25% royalty structure, this tool reflects the actual unit economics of this specific professional services concept.
The unit starts with a $22,000 EBITDA loss in the first year as you ramp up your lead funnel and staff. By year two, the model shows a swing to a $39,000 profit, eventually reaching $265,000 in annual EBITDA by year five. This franchise profitability projection spreadsheet tracks how your margins expand as placement volume increases. Profit isn't an accident; it's a scheduled event.
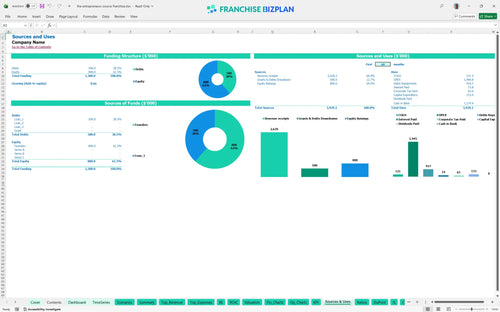
You need approximately $133,000 to launch this unit, covering everything from the franchise fee to your South End office setup. These franchise unit financial performance metrics show that the bulk of your capital goes toward the $75,000 brand access fee and $12,000 in office customization. Capital is fuel; don't start the engine with a half-empty tank.
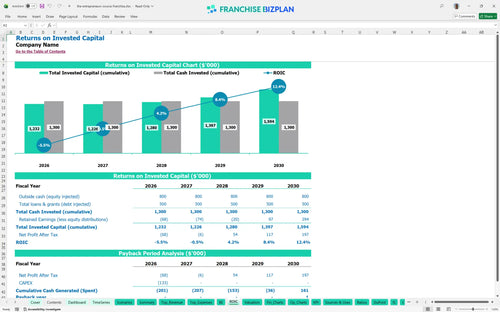
Based on the $825,000 revenue potential in year five, the franchise investment return on investment analysis shows a 2.5% IRR and a 0.37 ROE. You will defintely need to focus on long-term growth, as the payback period is estimated at 5 years. Patience is a financial virtue when payback takes half a decade.
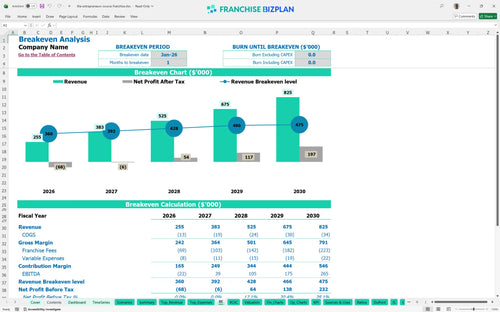
The model indicates a break-even date of January 2026, meaning you need to close your first major placement almost immediately to cover your initial overhead. Estimating operating expenses for a franchise unit shows that your $4,550 monthly fixed costs are the primary hurdle. Speed to break-even is the only metric that matters in month one.
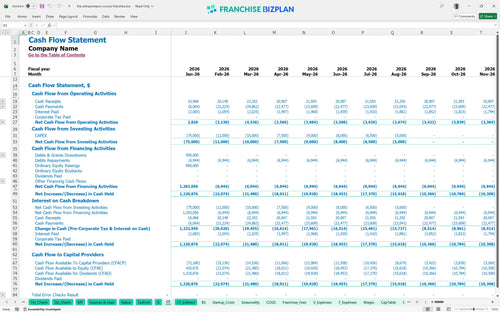
Using this cash flow template for new franchise owners, the lowest cash point is projected at $977,000 in December 2028. This suggests a significant capital buffer is maintained to handle the 25% royalty burden and the $114,200 year-one wage bill. Cash is oxygen, and your runway is the air tank.
This business feasibility study compares how a 20% drop in placement commissions impacts your year-one EBITDA loss. In the high scenario, faster revenue growth significantly shortens the 5-year payback and improves the 2.5% IRR. Planning for the worst makes the best-case scenario much more likely.
Finance: update unit break-even and payback model by Friday.
This franchise financial model is built in Excel to give you total control over your numbers. You can adjust pre-filled formulas and editable assumptions to see how to calculate franchise startup costs in Excel for your specific territory. It is a flexible tool that lets you swap out local rent or adjust staffing levels to see the immediate impact on your bottom line. Customization is the difference between a generic guess and a real plan.

Success in professional services requires a long-term view, and this franchise business plan template provides a clear 5-year roadmap. We map out revenue growth from $255,000 in year one to $825,000 by year five, alongside detailed cash flow and profit projections. This franchise profitability analysis helps you visualize the transition from a solo operation to a fully staffed coaching office. Five years is a lifetime in small business, but you need the map anyway.

Managing ongoing costs is vital when analyzing franchise royalty and marketing fund costs. This model tracks the 25% royalty fee and 2% marketing fund contribution, ensuring you see exactly how much of your placement commissions stays in your pocket. By accounting for the $75,000 initial fee upfront, you get a realistic view of your ongoing franchise royalty fees and obligations. Royalties are the rent you pay for a proven system.

Launching a coaching unit requires more than just a desk; you need to account for office customization, AV equipment, and training certifications. Our model breaks down these startup costs and performs a detailed break-even analysis to show when your placement fees will finally cover your $4,550 in monthly fixed expenses. Understanding your franchise unit economics early prevents nasty surprises during the first quarter. Knowing your zero-point keeps the lights on during the ramp-up.

We include built-in benchmarks so you can use this as a franchise investment calculator to sanity-check your projections against industry standards. Whether you are looking at labor costs for your senior coach or marketing spend for LinkedIn leads, these metrics help you follow best practices for franchise financial forecasting. It is a reality check for your business goals. Benchmarks keep your ego from writing checks your cash flow can't cover.


Simply purchase and download the financial model template, then access it instantly using Microsoft Excel or Google Sheets. No installation or technical expertise required-just open and start working.

Enter your business-specific numbers, including revenue projections, costs, and investment details. The pre-built formulas will automatically calculate financial insights, saving you time and effort.

Leverage the investor-ready format to confidently showcase your financial projections to banks, franchise representatives, or investors. Impress stakeholders with clear, data-driven insights and professional reports.

Leverage the investor-ready format to confidently present your projections to banks, franchise representatives, or investors.