
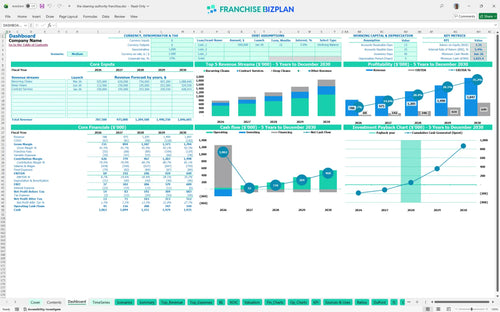
All-in-one Dashboard
Core inputs and core outputs


This cleaning franchise unit financial projection template provides a professional-grade Excel workbook with integrated revenue drivers, expense tracking, and 5-year projections for a residential cleaning operation.
Core inputs and core outputs
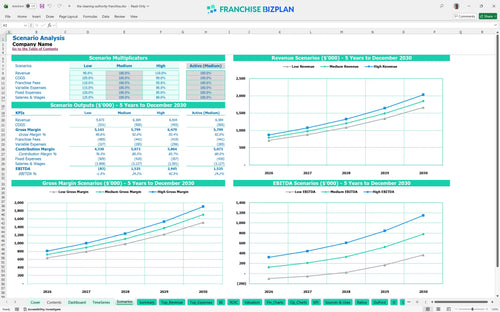
Three scenario analysis
Presentation ready
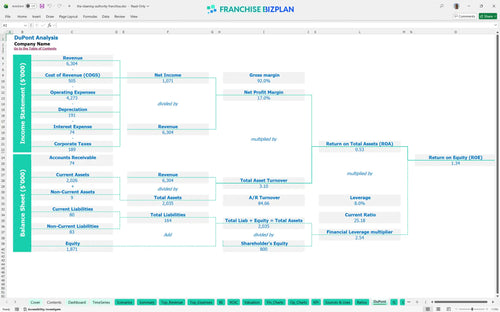
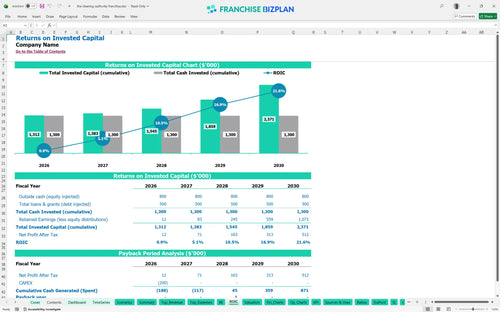
DuPont analysis
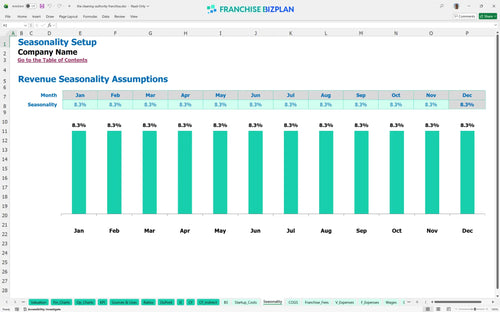
Researched revenue assumptions
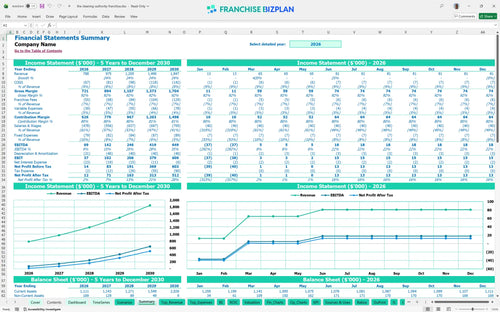
Lender-friendly financial outputs
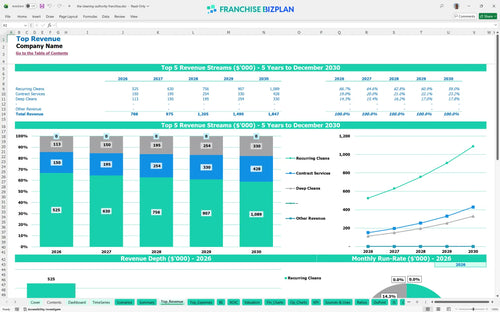
Revenue stream detailed view
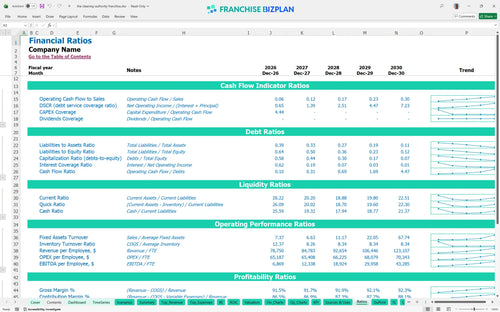
Performance metrics benchmark
We built this franchise unit financial model using our own research into the residential cleaning sector. Key assumptions, including the $20,000 franchise fee and $6,600 in monthly fixed costs, are pre-populated with researched data specific to The Cleaning Authority Franchise franchise unit and are fully editable. This tool helps you track how revenue scales from $788,000 in year one to over $1.8 million by year five.
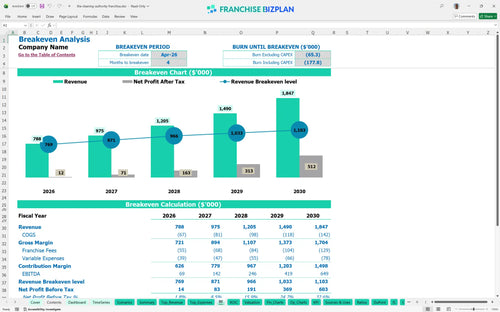
The unit becomes profitable in year one with an EBITDA of $69,000 after accounting for all COGS, royalties, and fixed costs. Based on the 5-year forecast, the net profit grows significantly as the recurring revenue model stabilizes and route density improves.
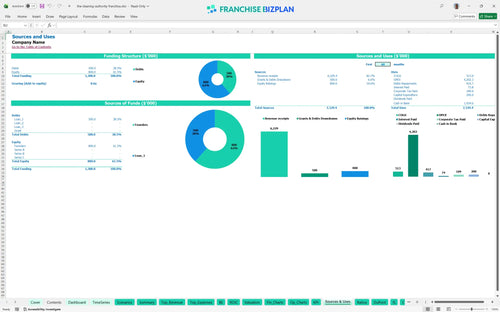
Launching this unit requires a total initial investment covering the $20,000 franchise fee and $200,000 in total CAPEX for items like vans and equipment. The model accounts for a minimum cash requirement of $1,025,000 to ensure you defintely have enough liquidity during the ramp-up phase.
Investors can expect an Internal Rate of Return (IRR) of 5.39% and a Return on Equity (ROE) of 1.34. The years to payback is estimated at 3 years, which is a solid timeframe for a service-based franchise with significant initial vehicle and equipment investments.
The monthly break-even level is reached in April 2026, just 4 months after launch. This quick turnaround is driven by the high demand for recurring residential cleaning and the ability to scale the cleaner workforce to match volume.
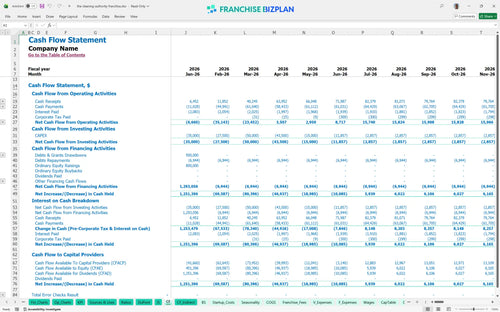
The lowest cash point occurs in June 2026 at $1,025,000, suggesting that a significant cash buffer is built into the initial funding. This runway is necessary to cover the gap between hiring staff and reaching full route capacity in affluent territories.
The franchise profitability analysis spreadsheet shows that hitting a High scenario can significantly boost year-1 margins and pull the payback period forward. Variations in labor costs and local marketing effectiveness are the primary drivers that shift the unit from a $69,000 EBITDA to much higher performance levels.
This cleaning franchise financial model is fully customizable in Excel, allowing you to tweak every line item to match your specific territory. With pre-filled formulas and editable assumptions, you can easily adjust for local labor rates or specific rent costs in your target market. It is a flexible tool designed to handle any operating scenario you might face during your residential cleaning franchise business plan development.

Planning for a service business requires looking past the first few months to see the full 5-year horizon. This model provides detailed revenue and cash flow projections, showing how your EBITDA grows from $69,000 in year one to $649,000 by year five. Mapping out long-term profitability ensures you stay ahead of scaling challenges as your fleet of vans expands and your recurring revenue model matures.

Understanding the real cost of franchise royalty fees is vital for any service industry financial forecasting. The model tracks the 6% royalty and 1% marketing fund contributions against your gross sales to show exactly how much goes to the franchisor. By inputting the $20,000 initial franchise fee, you get a clear picture of your total financial obligations from day one without any surprises.

Use the franchise startup cost calculator to estimate the total capital needed before you open your doors. It breaks down the initial investment, including $30,000 for office setup and $25,000 for equipment, to determine the exact sales volume required to cover your $6,600 in monthly fixed costs. Knowing your break-even point helps you manage the early months when cash is tightest and every dollar counts.

This cleaning business profit and loss template includes built-in benchmarks to help you sanity-check your numbers against industry standards. For instance, if your cleaning supplies exceed 7% of revenue, the model flags it so you can investigate waste or pricing issues. It is like having a CFO look over your shoulder to ensure your margins stay within a healthy range while you focus on territory management.


Simply purchase and download the financial model template, then access it instantly using Microsoft Excel or Google Sheets. No installation or technical expertise required-just open and start working.

Enter your business-specific numbers, including revenue projections, costs, and investment details. The pre-built formulas will automatically calculate financial insights, saving you time and effort.

Leverage the investor-ready format to confidently showcase your financial projections to banks, franchise representatives, or investors. Impress stakeholders with clear, data-driven insights and professional reports.

Leverage the investor-ready format to confidently present your projections to banks, franchise representatives, or investors.