
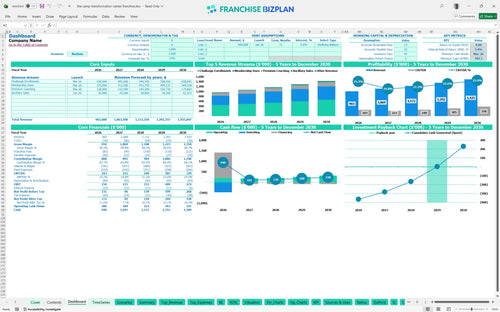
All-in-one Dashboard
Core inputs and core outputs

This comprehensive financial tool provides a detailed roadmap for launching and scaling a high-performance fitness studio with pre-populated researched data.
Core inputs and core outputs
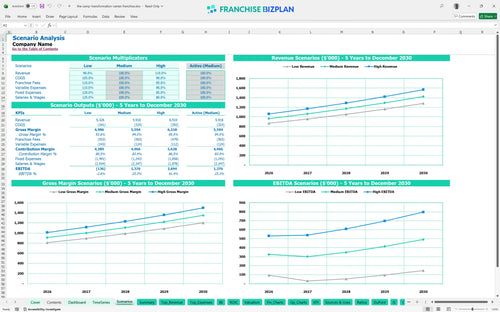
Three scenario analysis
Presentation ready
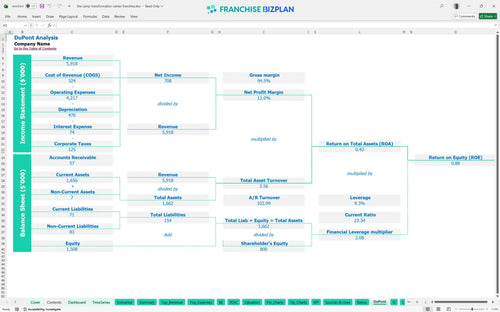
DuPont analysis
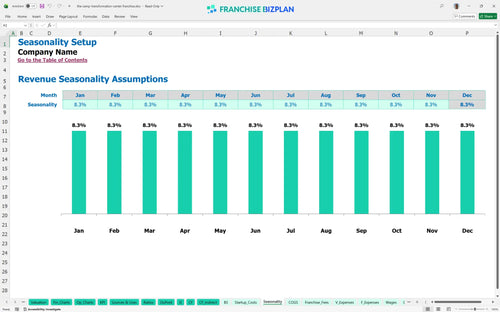
Researched revenue assumptions
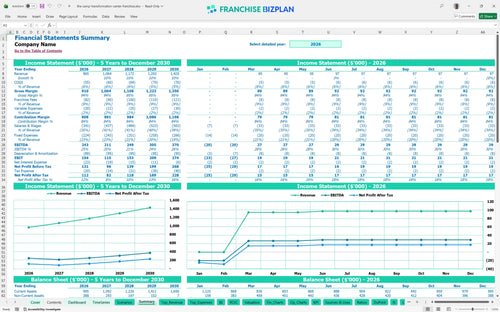
Lender-friendly financial outputs
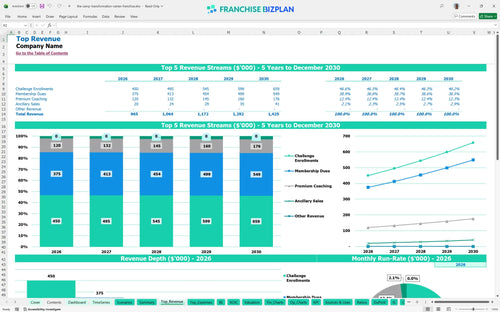
Revenue stream detailed view
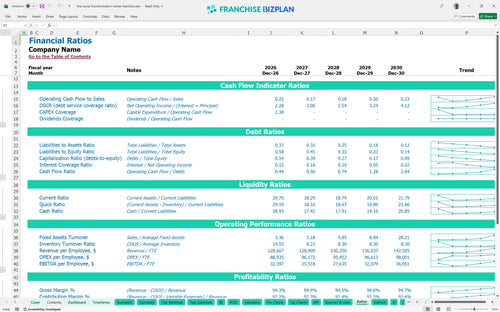
Performance metrics benchmark
We built this fitness franchise financial model using our own research to help you project monthly membership revenue for gym operations. Key assumptions like challenge enrollments starting at $300,000 and recurring membership dues are pre-populated with researched data and are fully editable. With a Year 1 EBITDA of $243,000 and a 3-month breakeven, this tool provides the data-driven clarity needed to evaluate this specific fitness concept.
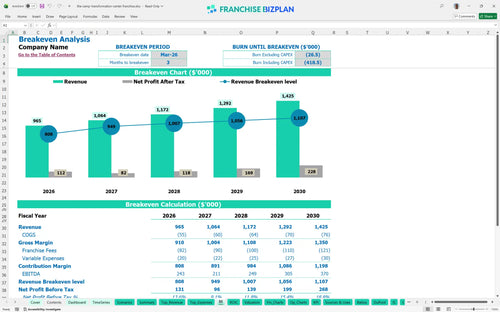
This unit reaches profitability almost immediately, with a breakeven date of March 2026. After accounting for a 6% royalty and $12,000 monthly rent, the model shows a Year 1 EBITDA of $243,000. You can expect a full payback on your initial investment within 4 years if you maintain the projected $550,000 in combined challenge and membership revenue during the first twelve months.
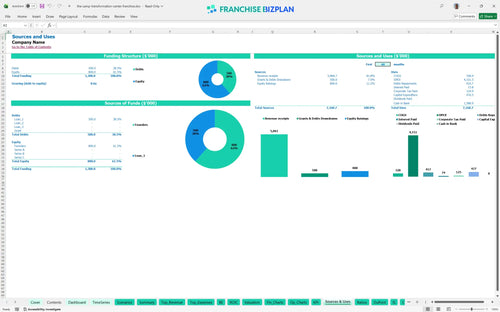
You will need approximately $782,000 in total capital to cover the core build-out, fees, and initial operating losses. This includes a $49,500 franchise fee, $180,000 for leasehold improvements, and $95,000 for cardio and strength equipment. The model also accounts for a cash buffer to handle the ramp-up phase and ensure you meet the minimum cash requirements during the first year.
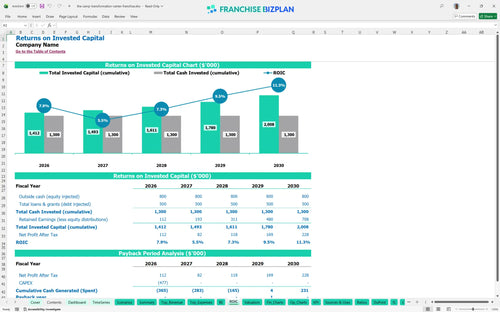
Using this franchise ROI calculator, you can see an Internal Rate of Return of 3.35% and a 4-year payback period. While the Year 1 EBITDA is a strong $243,000, the model shows how reinvesting in staff and equipment maintenance affects your long-term return on equity, which stands at 0.88. It provides the precise metrics needed to justify the investment to partners or lenders.
Breakeven occurs in Month 3, specifically March 2026, once the initial 6-week challenge enrollments and membership dues kick in. The biggest lever for staying above this line is the $12,000 monthly rent, which requires high throughput in the urban core. If enrollment volume drops by even 10%, the timeline to cover fixed costs like the $1,500 monthly janitorial and $2,000 utility bills stretches significantly.
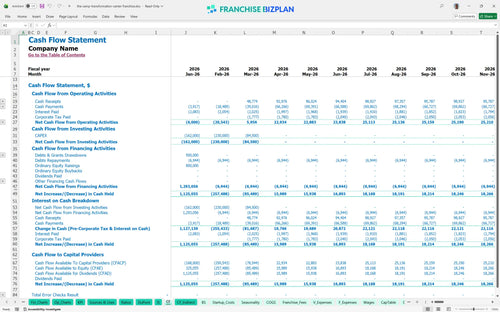
Financial forecasting for health and fitness business operations reveals a lowest cash point of $782,000 during the ramp-up. You defintely need to manage your $20,000 in ancillary sales launch timing to protect your runway. The model suggests keeping a close eye on the $2,000 monthly utility and $1,500 janitorial costs during the first six months of trading to avoid unnecessary cash burn.
The model allows you to toggle between scenarios to see how fitness business EBITDA shifts with market demand. A High scenario with better retention improves your Year 1 margin significantly, while a Low scenario highlights the risk of high labor costs for coaches. This sensitivity analysis is vital for mapping out your local marketing execution and staffing needs as you scale to $1.4 million in revenue.
This fitness franchise financial model is a fully customizable Excel tool designed for precision. You can adjust pre-filled formulas and editable assumptions to fit your specific location, whether you are looking for a fitness franchise financial model excel template or a custom build-out plan. It simplifies complex gym economics into a clear, actionable roadmap for any operator.

The franchise unit financial projection spreadsheet provides a comprehensive 5-year outlook for your fitness studio financial projections. It tracks revenue growth from $965,000 in Year 1 to over $1.4 million by Year 5, ensuring your franchise business plan template is backed by realistic cash flow and profit data. This long-term view helps you spot margin leaks before they impact your bottom line.

Managing franchise operating expenses is critical when royalties and marketing fees are tied to top-line sales. This model calculates the 6% royalty and 2.5% marketing fund contributions automatically, giving you a clear view of the operating costs for a weight loss fitness center. By tracking these obligations alongside $12,000 monthly rent, you can maintain a realistic store-level margin.

Understanding gym franchise startup costs is the first step to a successful launch. This model helps you learn how to calculate startup costs for a fitness franchise, including the $49,500 initial fee and $180,000 leasehold improvements. It pairs these costs with a break-even analysis to show exactly when your monthly revenue will cover your fixed and variable obligations.

The model includes industry benchmarks to help you complete your franchise business plan financial section example with confidence. You can compare your $70,000 GM salary and $60,000 head trainer costs against standard labor percentages to ensure your staffing plan is efficient. These benchmarks act as a sanity check for your occupancy and gross margin assumptions.


Simply purchase and download the financial model template, then access it instantly using Microsoft Excel or Google Sheets. No installation or technical expertise required-just open and start working.

Enter your business-specific numbers, including revenue projections, costs, and investment details. The pre-built formulas will automatically calculate financial insights, saving you time and effort.

Leverage the investor-ready format to confidently showcase your financial projections to banks, franchise representatives, or investors. Impress stakeholders with clear, data-driven insights and professional reports.

Leverage the investor-ready format to confidently present your projections to banks, franchise representatives, or investors.