
All-in-one Dashboard
Core inputs and core outputs


This comprehensive financial tool provides everything a prospective owner needs to forecast revenue, manage expenses, and evaluate the long-term viability of a specialty retail unit.
Core inputs and core outputs
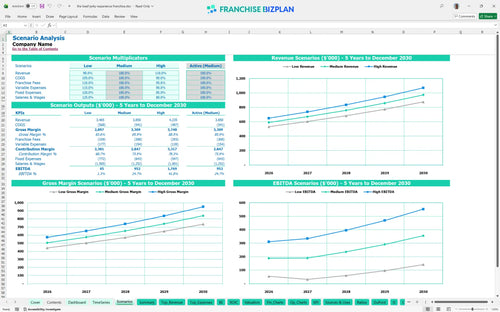
Three scenario analysis
Presentation ready
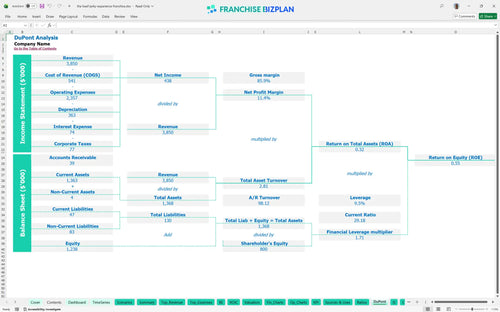
DuPont analysis
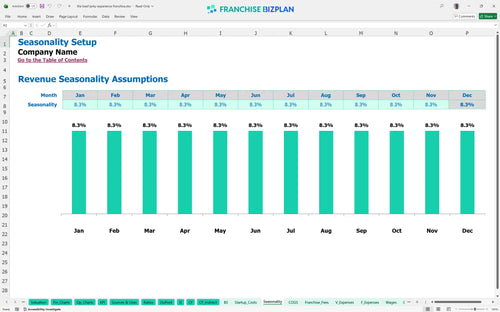
Researched revenue assumptions
Lender-friendly financial outputs
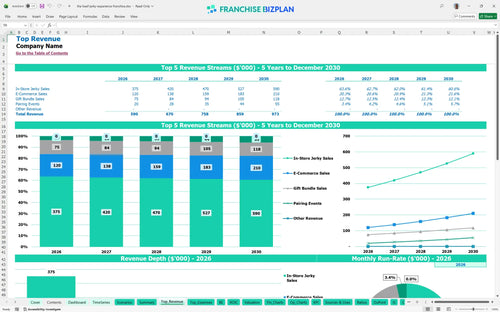
Revenue stream detailed view
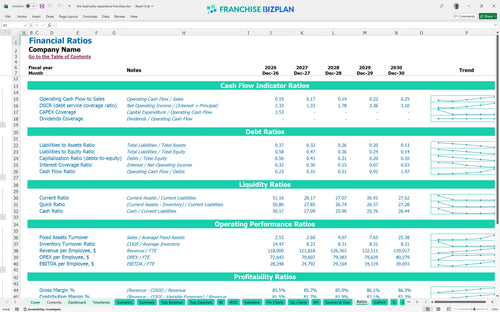
Performance metrics benchmark
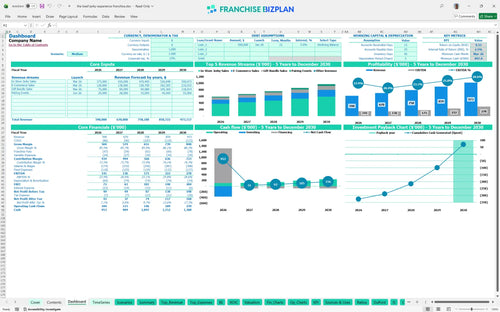
We developed this franchise unit profitability spreadsheet based on detailed research into specialty snack retail operations. The model includes pre-populated data for revenue streams like in-store sales and e-commerce, along with fixed costs like the $7,500 monthly rent, all of which you can edit to fit your specific market. Speed to profit is defintely the name of the game here.
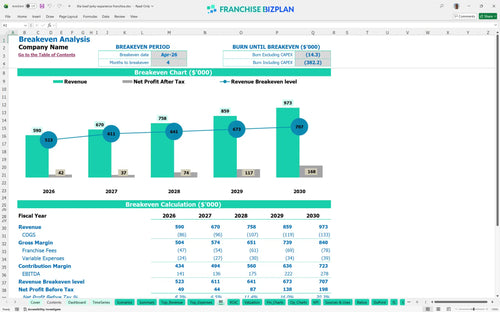
This specialty retail unit is projected to reach profitability in April 2026, just four months after launching. With Year 1 EBITDA estimated at $141,000, the model accounts for a 6% royalty and 2% marketing fee while scaling revenue from $590,000 in the first year to $973,000 by year five.
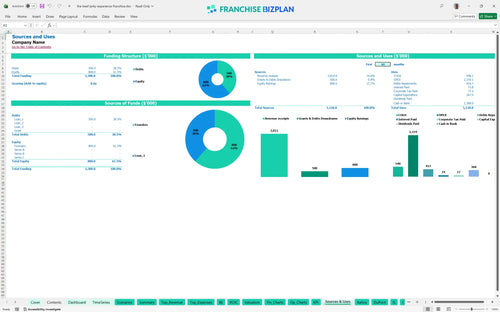
Launching this unit requires a total investment of approximately $367,900, covering everything from the initial fee to store setup. This capital expenditure forecasting includes $150,000 for leasehold improvements and $50,000 for display cases to ensure the store meets premium brand standards from day one.
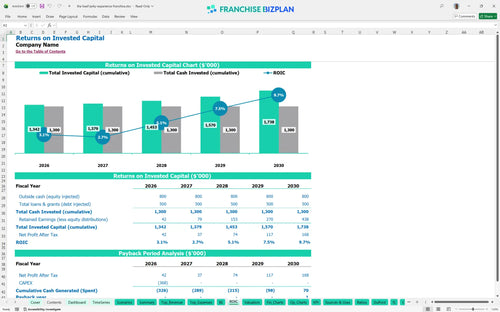
Using this franchise investment calculator, you can see a projected Internal Rate of Return (IRR) of 2.51% and a Return on Equity (ROE) of 0.55. The franchise investment return on investment calculator estimates a 5-year payback period, which is a standard horizon for specialty food retail recovery.
The break-even analysis for retail shows the unit covers its $10,150 in monthly fixed costs by April 2026. Your ability to hit this target depends heavily on managing the $7,500 monthly rent and ensuring the 14.5% combined COGS and variable expenses don't creep upward during the ramp-up phase.
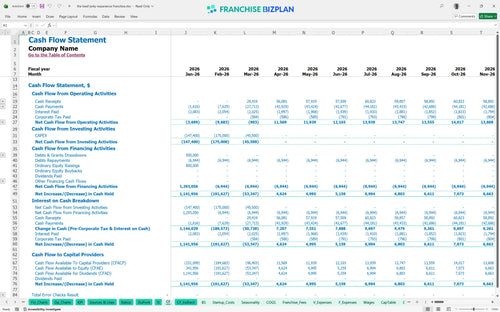
The model identifies March 2026 as the minimum cash point, with a required liquidity buffer of $897,000 to handle the initial build-out and early operating losses. Estimating inventory costs for food retail franchise units is vital here, as you need to stock over 100 varieties before the first customer walks in.
Financial forecasting for small franchise units requires looking at Low, Medium, and High performance levels. While the base case shows Year 5 EBITDA at $278,000, a 10% drop in traffic could delay your payback period, while strong local marketing execution could significantly pull that date forward.
This franchise financial model template is built in Excel to give you total control over your projections. You can adjust pre-filled formulas and editable assumptions to match your specific territory, local labor rates, and lease terms, making it a versatile retail store profit and loss Excel template for any scenario.

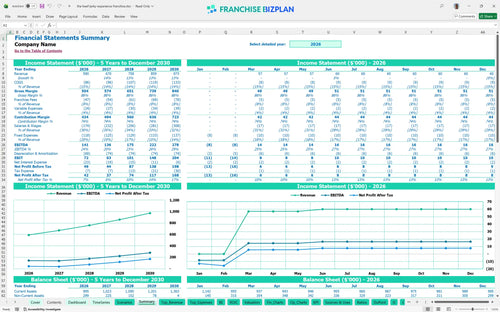
Planning for a retail franchise business plan requires a long-term view of cash flow and sustainability. This model provides a detailed Franchise P&L statement across 60 months, using a gourmet food franchise financial projections template to track how your unit matures from its grand opening to year five.

Understanding your obligations to the franchisor is critical for maintaining store-level margins. This franchise business plan financial model spreadsheet simplifies analyzing franchise royalty and marketing fees, ensuring you account for the 6% royalty and 2% brand fund contributions that impact your monthly bottom line.

Success starts with a clear franchise startup cost analysis to prevent mid-project funding gaps. This tool teaches you how to calculate startup costs for a retail franchise by mapping out leasehold improvements, equipment, and initial inventory against your projected sales to find your exact break-even point.

We integrated franchise unit economics and franchise operating expenses benchmarks to help you validate your budget. Use this operating budget template for specialty food store management to compare your rent, labor, and COGS (cost of goods sold) against industry standards to ensure your model stays realistic.


Simply purchase and download the financial model template, then access it instantly using Microsoft Excel or Google Sheets. No installation or technical expertise required-just open and start working.

Enter your business-specific numbers, including revenue projections, costs, and investment details. The pre-built formulas will automatically calculate financial insights, saving you time and effort.

Leverage the investor-ready format to confidently showcase your financial projections to banks, franchise representatives, or investors. Impress stakeholders with clear, data-driven insights and professional reports.

Leverage the investor-ready format to confidently present your projections to banks, franchise representatives, or investors.